-
NI Community
- Welcome & Announcements
-
Discussion Forums
- Most Active Software Boards
- Most Active Hardware Boards
-
Additional NI Product Boards
- Academic Hardware Products (myDAQ, myRIO)
- Automotive and Embedded Networks
- DAQExpress
- DASYLab
- Digital Multimeters (DMMs) and Precision DC Sources
- Driver Development Kit (DDK)
- Dynamic Signal Acquisition
- FOUNDATION Fieldbus
- High-Speed Digitizers
- Industrial Communications
- IF-RIO
- LabVIEW Communications System Design Suite
- LabVIEW Electrical Power Toolkit
- LabVIEW Embedded
- LabVIEW for LEGO MINDSTORMS and LabVIEW for Education
- LabVIEW MathScript RT Module
- LabVIEW Web UI Builder and Data Dashboard
- MATRIXx
- Hobbyist Toolkit
- Measure
- NI Package Manager (NIPM)
- Phase Matrix Products
- RF Measurement Devices
- SignalExpress
- Signal Generators
- Switch Hardware and Software
- USRP Software Radio
- NI ELVIS
- VeriStand
- NI VideoMASTER and NI AudioMASTER
- VirtualBench
- Volume License Manager and Automated Software Installation
- VXI and VME
- Wireless Sensor Networks
- PAtools
- Special Interest Boards
- Community Documents
- Example Programs
-
User Groups
-
Local User Groups (LUGs)
- Aberdeen LabVIEW User Group (Maryland)
- Advanced LabVIEW User Group Denmark
- ANZ (Australia & New Zealand) LabVIEW User Group
- ASEAN LabVIEW User Group
- Automated T&M User Group Denmark
- Bangalore LUG (BlrLUG)
- Barcelona LabVIEW Local User Group (BarVIEWona LUG)
- Bay Area LabVIEW User Group
- Bordeaux Atlantique LabVIEW User Group - BATLUG
- The Boston LabVIEW User Group Community
- British Columbia LabVIEW User Group Community
- Budapest LabVIEW User Group (BudLUG)
- Chennai LUG (CHNLUG)
- Chicago LabVIEW User Group
- Cleveland LabVIEW User Group
- CLUG : Cambridge LabVIEW User Group (UK)
- CSLUG - Central South LabVIEW User Group (UK)
- Dallas Fort Worth (DFW) LabVIEW User Group
- OKC LabVIEW User Group
- Delhi NCR (NCRLUG)
- Denver - ALARM
- DMC LabVIEW User Group
- DutLUG - Dutch LabVIEW Usergroup
- Middle East LabVIEW Local User Group (MELUG)
- Gainesville LabVIEW User Group
- GLA Summit - For all LabVIEW and TestStand Enthusiasts!
- GUNS
- Houston LabVIEW User Group
- High Desert LabVIEW User Group
- Highland Rim LabVIEW User Group
- Huntsville Alabama LabVIEW User Group
- Hyderabad LUG (HydLUG)
- Indian LabVIEW Users Group (IndLUG)
- Ireland LabVIEW User Group Community
- ItalVIEW - Milan, Italy LabVIEW+ Local User Group
- Israel LabVIEW User Group
- LabVIEW-FISICC
- LabVIEW GYM
- LabVIEW LATAM
- LabVIEW User Group Nantes
- LabVIEW Team Indonesia
- LabVIEW - University of Applied Sciences Esslingen
- LabVIEW User Group Berlin
- LabVIEW User Group Central Europe (LUG CE)
- LabVIEW User Group Euregio
- LabVIEW User Group Munich
- LabVIEW Vietnam
- London LabVIEW User Group
- Long Island NY LabVIEW User Group
- Louisville KY LabView User Group
- LUGG - LabVIEW User Group at Goddard
- LUGE - Rhône-Alpes et plus loin
- LUGNuts: LabVIEW User Group for Connecticut
- LUG of Kolkata & East India (EastLUG)
- LVUG Hamburg
- Madison LabVIEW User Group Community
- Madrid LabVIEW Local User Group (MadLUG)
- Mass Compilers
- Midlands LabVIEW User Group
- Milwaukee LabVIEW Community
- Minneapolis LabVIEW User Group
- Montreal/Quebec LabVIEW User Group Community - QLUG
- NASA LabVIEW User Group Community
- Nebraska LabVIEW User Community
- New Zealand LabVIEW Users Group
- NI UK and Ireland LabVIEW User Group
- NOBLUG - North Of Britain LabVIEW User Group
- NOCLUG
- NORDLUG Nordic LabVIEW User Group
- North Oakland County LabVIEW User Group
- Norwegian LabVIEW User Group
- NWUKLUG
- RT LabVIEW User Group
- Orange County LabVIEW Community
- Orlando LabVIEW User Group
- Ottawa and Montréal LabVIEW User Community
- Pasadena LabVIEW User Group
- Philippines LabVIEW Local User Group (FilLUG)
- Phoenix LabVIEW User Group (PLUG)
- Politechnika Warszawska
- PolŚl
- Portland Oregon LabVIEW User Group
- Rhein-Main Local User Group (RMLUG)
- Rhein-Ruhr LabVIEW User Group
- Romandie LabVIEW User Group
- Romania LabVIEW Local User Group (RoLUG)
- Rutherford Appleton Laboratory (STFC) - RALLUG
- Serbia LabVIEW User Group
- Sacramento Area LabVIEW User Group
- San Diego LabVIEW Users
- Sheffield LabVIEW User Group
- Silesian LabVIEW User Group (PL)
- South East Michigan LabVIEW User Group
- Southern Ontario LabVIEW User Group Community
- South Sweden LabVIEW User Group
- SoWLUG (UK)
- Space Coast Area LabVIEW User Group
- Stockholm LabVIEW User Group (STHLUG)
- Swiss LabVIEW User Group
- Swiss LabVIEW Embedded User Group
- Sydney User Group
- Taiwan LabVIEW User Group (TWLUG)
- Top of Utah LabVIEW User Group
- TU Delft LabVIEW User Group (TUDLUG)
- UKTAG – UK Test Automation Group
- Utahns Using TestStand (UUT)
- UVLabVIEW
- Valencia LabVIEW Local User Group (ValLUG)
- VeriStand: Romania Team
- WaFL - Salt Lake City Utah USA
- Washington Community Group
- Western NY LabVIEW User Group
- Western PA LabVIEW Users
- West Sweden LabVIEW User Group
- WPAFB NI User Group
- WUELUG - Würzburg LabVIEW User Group (DE)
- Yorkshire LabVIEW User Group
- Zero Mile LUG of Nagpur (ZMLUG)
- 日本LabVIEWユーザーグループ
- [IDLE] LabVIEW User Group Stuttgart
- [IDLE] ALVIN
- [IDLE] Barcelona LabVIEW Academic User Group
- [IDLE] Brazil User Group
- [IDLE] Calgary LabVIEW User Group Community
- [IDLE] CLUG - Charlotte LabVIEW User Group
- [IDLE] Central Texas LabVIEW User Community
- [IDLE] Grupo de Usuarios LabVIEW - Chile
- [IDLE] Indianapolis User Group
- [IDLE] LA LabVIEW User Group
- [IDLE] LabVIEW User Group Kaernten
- [IDLE] LabVIEW User Group Steiermark
- [IDLE] தமிழினி
- Academic & University Groups
-
Special Interest Groups
- Actor Framework
- Biomedical User Group
- Certified LabVIEW Architects (CLAs)
- DIY LabVIEW Crew
- LabVIEW APIs
- LabVIEW Champions
- LabVIEW Development Best Practices
- LabVIEW Web Development
- NI Labs
- NI Linux Real-Time
- NI Tools Network Developer Center
- UI Interest Group
- VI Analyzer Enthusiasts
- [Archive] Multisim Custom Simulation Analyses and Instruments
- [Archive] NI Circuit Design Community
- [Archive] NI VeriStand Add-Ons
- [Archive] Reference Design Portal
- [Archive] Volume License Agreement Community
- 3D Vision
- Continuous Integration
- G#
- GDS(Goop Development Suite)
- GPU Computing
- Hardware Developers Community - NI sbRIO & SOM
- JKI State Machine Objects
- LabVIEW Architects Forum
- LabVIEW Channel Wires
- LabVIEW Cloud Toolkits
- Linux Users
- Unit Testing Group
- Distributed Control & Automation Framework (DCAF)
- User Group Resource Center
- User Group Advisory Council
- LabVIEW FPGA Developer Center
- AR Drone Toolkit for LabVIEW - LVH
- Driver Development Kit (DDK) Programmers
- Hidden Gems in vi.lib
- myRIO Balancing Robot
- ROS for LabVIEW(TM) Software
- LabVIEW Project Providers
- Power Electronics Development Center
- LabVIEW Digest Programming Challenges
- Python and NI
- LabVIEW Automotive Ethernet
- NI Web Technology Lead User Group
- QControl Enthusiasts
- Lab Software
- User Group Leaders Network
- CMC Driver Framework
- JDP Science Tools
- LabVIEW in Finance
- Nonlinear Fitting
- Git User Group
- Test System Security
- Developers Using TestStand
- Online LabVIEW Evaluation 'Office Hours'
- Product Groups
-
Partner Groups
- DQMH Consortium Toolkits
- DATA AHEAD toolkit support
- GCentral
- SAPHIR - Toolkits
- Advanced Plotting Toolkit
- Sound and Vibration
- Next Steps - LabVIEW RIO Evaluation Kit
- Neosoft Technologies
- Coherent Solutions Optical Modules
- BLT for LabVIEW (Build, License, Track)
- Test Systems Strategies Inc (TSSI)
- NSWC Crane LabVIEW User Group
- NAVSEA Test & Measurement User Group
-
Local User Groups (LUGs)
-
Idea Exchange
- Data Acquisition Idea Exchange
- DIAdem Idea Exchange
- LabVIEW Idea Exchange
- LabVIEW FPGA Idea Exchange
- LabVIEW Real-Time Idea Exchange
- LabWindows/CVI Idea Exchange
- Multisim and Ultiboard Idea Exchange
- NI Measurement Studio Idea Exchange
- NI Package Management Idea Exchange
- NI TestStand Idea Exchange
- PXI and Instrumentation Idea Exchange
- Vision Idea Exchange
- Additional NI Software Idea Exchange
- Blogs
-
Events & Competitions
- FIRST
- GLA Summit - For all LabVIEW and TestStand Enthusiasts!
- Events & Presentations Archive
- Optimal+
-
Regional Communities
- NI中文技术论坛
- NI台灣 技術論壇
- 한국 커뮤니티
- ディスカッションフォーラム(日本語)
- Le forum francophone
- La Comunidad en Español
- La Comunità Italiana
- Türkçe Forum
- Comunidade em Português (BR)
- Deutschsprachige Community
- المنتدى العربي
- NI Partner Hub
-
 Craig_S.
on:
Be Careful What You Register
-
 flarn2006
on:
New Structures in LabVIEW 2016
-
 d.w.b
on:
Programmatically Inspect Event Queues
Re: Programmatically Inspect Event Queues
- Subscribe to RSS Feed
- Mark as New
- Mark as Read
- Bookmark
- Subscribe
- Printer Friendly Page
- Report to a Moderator
Before I get in to this post I want to put just a bit of a disclaimer up front. Some of the topics I want to write about, including this one, fall outside the realm of NI support. These will be use at your own risk tools. That being said, everything in this post is in the shipping version of LabVIEW and does not require any knowledge not available online. Because a lot of this information is found through trial and error though, some things in this or future posts may not be completely correct so I encourage anyone reading to explore these topics more and let me know if I'm wrong.
The Event Inspector Window
Even though the title of this post is "Programmatically Inspect Event Queues" I want to spend a bit of time exploring our current options in LabVIEW. There are a couple reasons why I want to do this. First, the tools that ship with LabVIEW are probably going to be easier to use and are all you will need for most troubleshooting purposes. The other reason is that the API we will use has very little documentation so understanding the information provided by the built in tools will help us figure out how this API works.
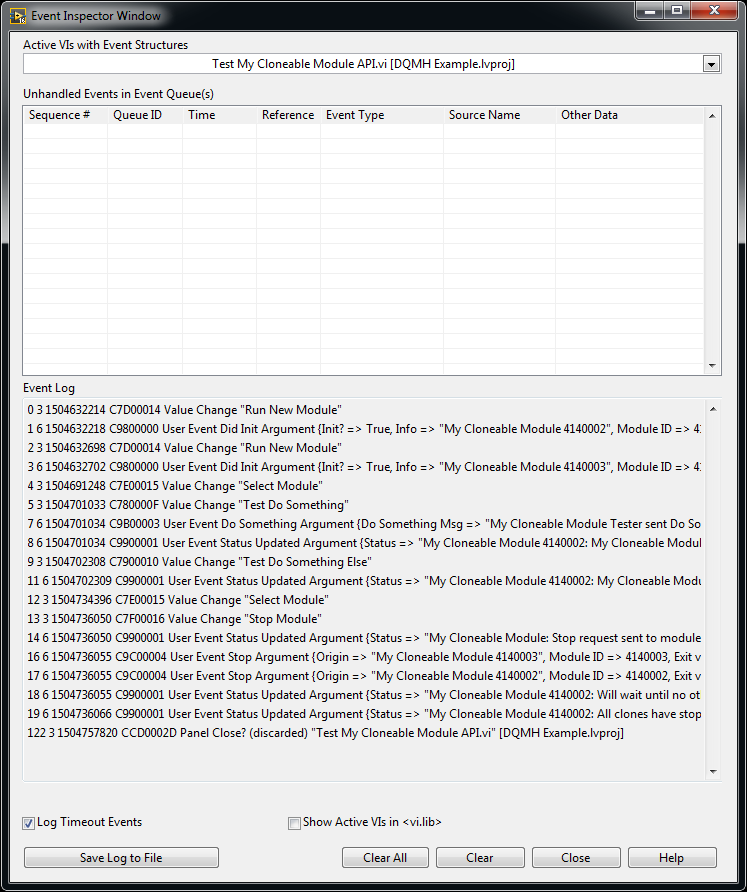
So, what is already available to us in LabVIEW? Well, as of LabVIEW 2013, you can open up the Event Inspector Window by either selecting View > Event Inspector Window or by choosing the same option when right clicking an Event Structure in a running VI. Something to note is that we can only see events that occurred after launching this window. As an example I ran "Test My Cloneable Module API.vi" which is a test VI for the Delacor Queued Message Handler sample project (which you can download off of VIPM).
Starting from the top, the first option is to select a VI from the list of all active VIs with event structures. Selecting a new VI will update the table of Unhandled Events of Event Queues in that VI and the Event Log which shows a list of all events handled since the event inspector window was launched. The table of Unhandled Events in Event Queue(s) and Evelt log show the same information for each event, just with different formatting. The information we have for each event is:
Sequence # - Specifies the monotonically increasing event sequence number. The sequence number starts from 0 when the LabVIEW application launches and shows the order at which the events occurred. This means that if a single event is registered in multiple VIs, this will show the same event with the same sequence number.
Queue ID - Specifies the ID for the event queue.
Time - Specifies the timestemp, in milliseconds, of the event when the event occurred. This is the same value returned by the tick count primitive.
Reference - Specifies the refnum to the event.
Event Type - Specifies the type of the event such as Mouse Move, Value Change, or User Event.
Source Name - Specifies the name of the object associated with the event. For most front panel events this is the name of the control or indicator.
Other Data - Specifies user event data
Other options we have are to filter timeout events and any events within vi.lib VIs as well as saving the contents of the Event Log window to a text file.
Accessing This Data Programmatically
Now that we know what LabVIEW can already do, what other functionality do we even need? Like I said in the beginning of this post, most of what you will want to do is covered by the Event Inspector Window. However, one thing you might want to do is compile a global list of all events that occurred in your application. LabVIEW does not give you a way to do this currently and even if you wanted a list after the application had finished execution, you would need to save each Event Log to an individual text file and write a program to get that into one master list. An even simpler reason for wanting access to this data is to be able to automate the process of launching this window and saving logs for troubleshooting purposes.
So not even knowing whether our goal of programmatically inspecting event queues is possible, where would we start to look? If you have been programming in LabVIEW for some time you may notice that a lot of dialog boxes in LabVIEW look like typical VI front panels, and if you have ever spent some time looking through the LabVIEW folder (which I recommend doing) you may have noticed the <LabVIEW>\resource\dialog folder where most of these dialog boxes reside. In the dialog folder for LabVIEW 2016 you will find a folder named Event Inspector with the following 3 VIs.
All of these VIs are locked and none have context help so we will have to make a few educated guesses as to what they do. We don't know for sure, but it is probably safe to say that Event Inspector Launcher.vi will simply launch Event Inspector.vi which is the window we were previously looking at. The final VI, EI Get Event Queue Data.vi looks a bit more promising for what we want to be doing.
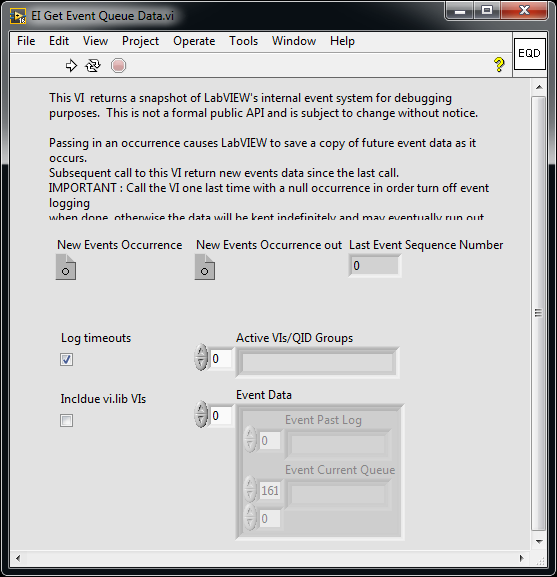
There may not be context help but there is a note on the front panel which give us an idea of how to use this VI. Part of the note isn't visible, so I had to do some scripting to get the whole message. I copied down the full message below and bolded a section everyone who wants to use this VI needs to be aware of.
This VI returns a snapshot of LabVIEW's internal event system for debugging purposes. This is not a formal public API and is subject to change without notice.
Passing in an occurrence causes LabVIEW to save a copy of future event data as it occurs.
Subsequent call to this VI return new events data since the last call.
IMPORTANT : Call the VI one last time with a null occurrence in order turn off event logging when done, otherwise the data will be kept indefinitely and may eventually run out of memory.
Calling this VI may disrupt the operation of the built-in Event Inspector Window and cause it to drop events.
There are a few things we learn from this label. First, we are going to use occurrences to turn logging on and off. A valid occurrence will start logging and a null occurrence will stop it. Every call made to this VI will return event data since the previous call and if calling this VI may disrupt the operation of the built-in Event Inspector Window, we will make the assumption that this VI should only be used in one location.
The output Active VIs/QUID Groups give us an array of strings which returns the name of all currently active VIs with event structures. Each element of the Active VIs array matches to the same index of the Event Data output array. To say this another way let's take the first event inspector window in this post, which shows the running VI "Test My Cloneable Module API.vi", as an example. In general "Test My Cloneable Module API.vi" would be at some index N of the Active VIs output. The relevant data for that VI would also be the Nth item of the Event Data array which contains a cluster of the items Event Past Log and Event Current Queue. The Event Past Log is a 1D array of strings where each string is a single line of the event log for all events since the last call of EI Get Event Queue Data. Event Current Queue is a 2D array of events that have occurred but not yet been processed. Each row is a single event and the columns are the same as those in the Event Inspector Window table (Sequence #, Queue ID, etc.).
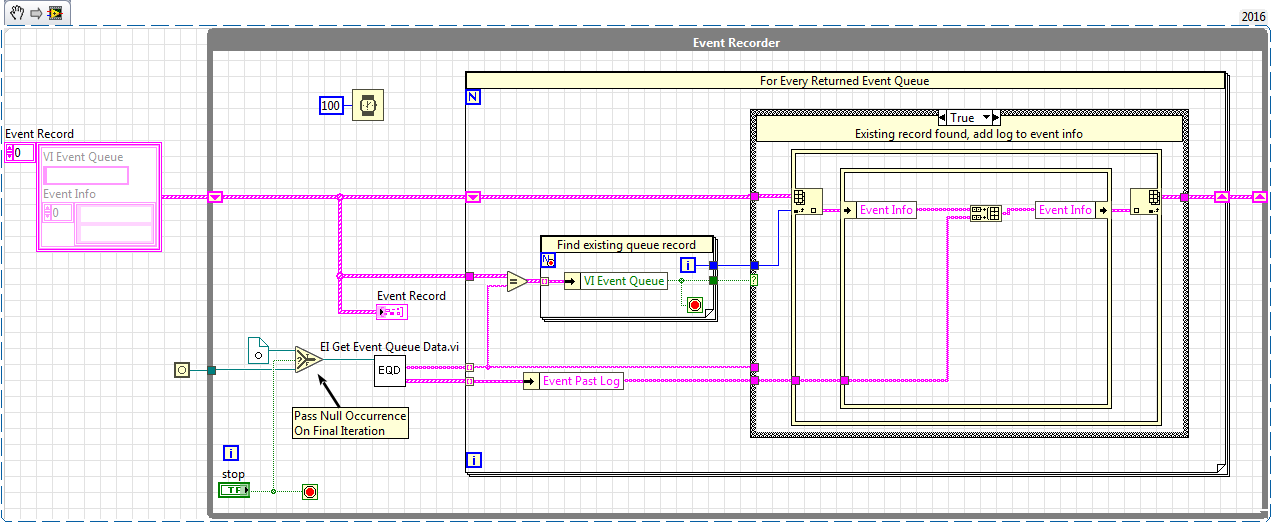
Now that we have access to this information we can format and do with it as we please. For instance, if we want to see the events for every VI which had an active event structure during execution, we could do something similar to what is shown below. And if you have some other clever ideas of how you can use the EI Get Event Queue Data, let me know in a comment.
Matt J
You must be a registered user to add a comment. If you've already registered, sign in. Otherwise, register and sign in.


