kl3m3n's blog

Community Browser
cancel
Showing results for 
Search instead for 
Did you mean: 
Klemen
12117 Views
5 Comments

Hello,

the purpose of this post is to evaluate and compare (only visually) the performance of the stereo vision libraries from OpenCV and Labview. I have used a pair of horizontally positioned webcameras (Logitech c210) mounted on a stand with a baseline distance of approximately 100 mm. The OpenCV stereo functions were built as a .dll and called in Labview (FULL CALIBRATION AND MEASUREMENT EXAMPLE IS A PART OF Labview PCLOpenCV Toolkit THAT CAN BE DOWNLOADED FROM ONE OF MY PREVIOUS POSTS). One of the advantages of the OpenCV calibration procedure is that the rectification transformation for both cameras can be accessed, while this is (to my knowledge) impossible in Labview. All parameters regarding the calibration are saved in a user-specified file and are read during the measurement procedure.

The calibration based on Labview's stereo library can be found here:

https://decibel.ni.com/content/blogs/kl3m3n/2013/07/26/stereo-setup-parameters-calculation-and-labvi...

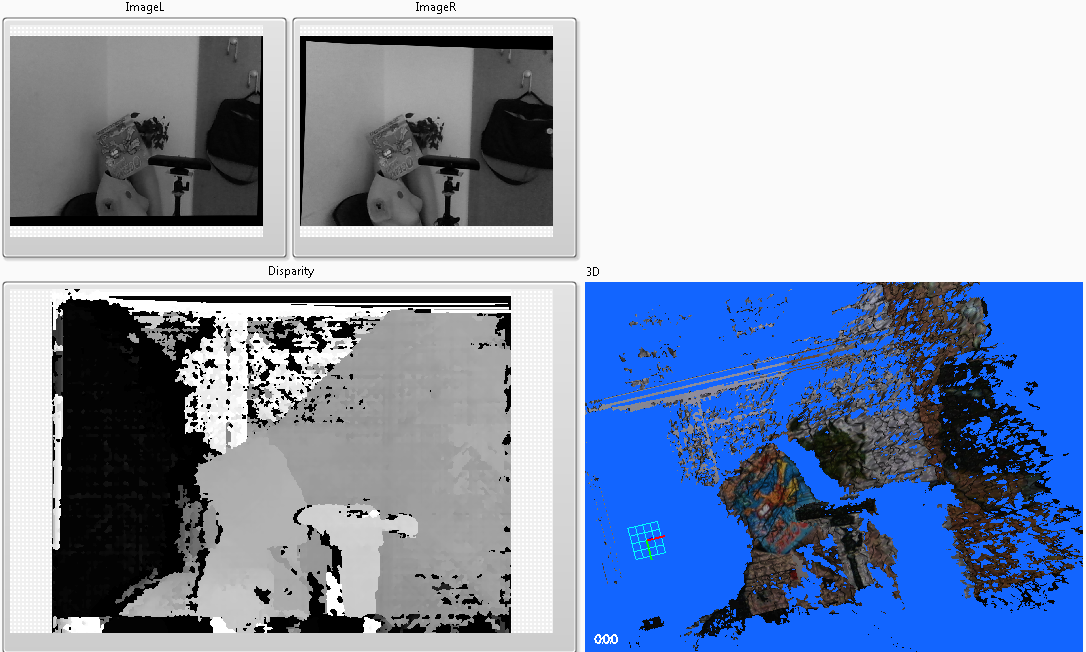
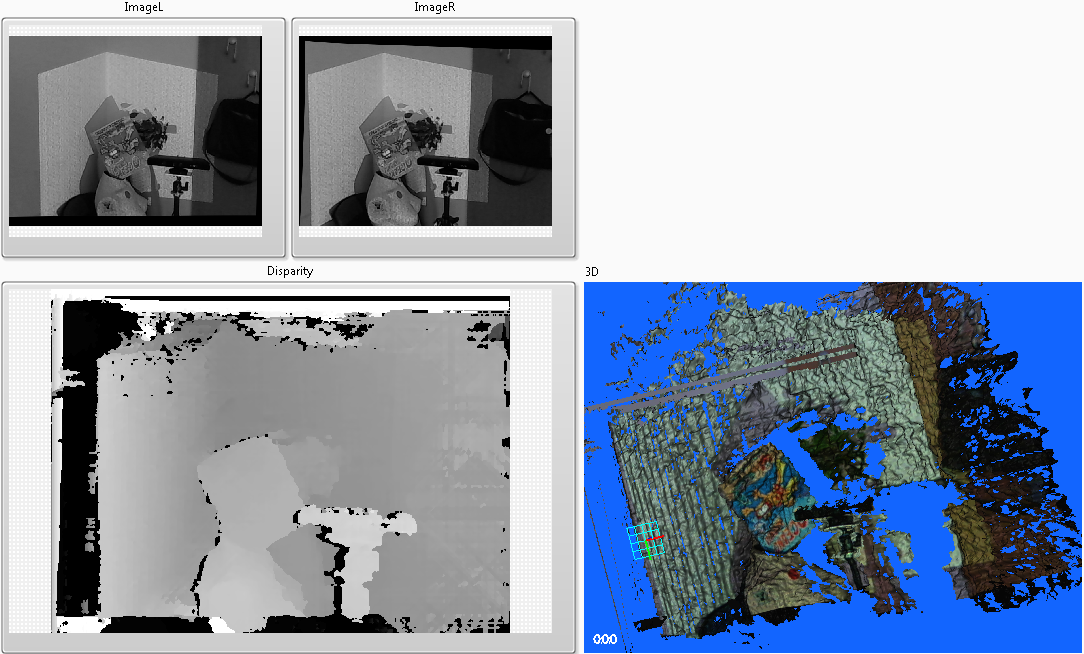
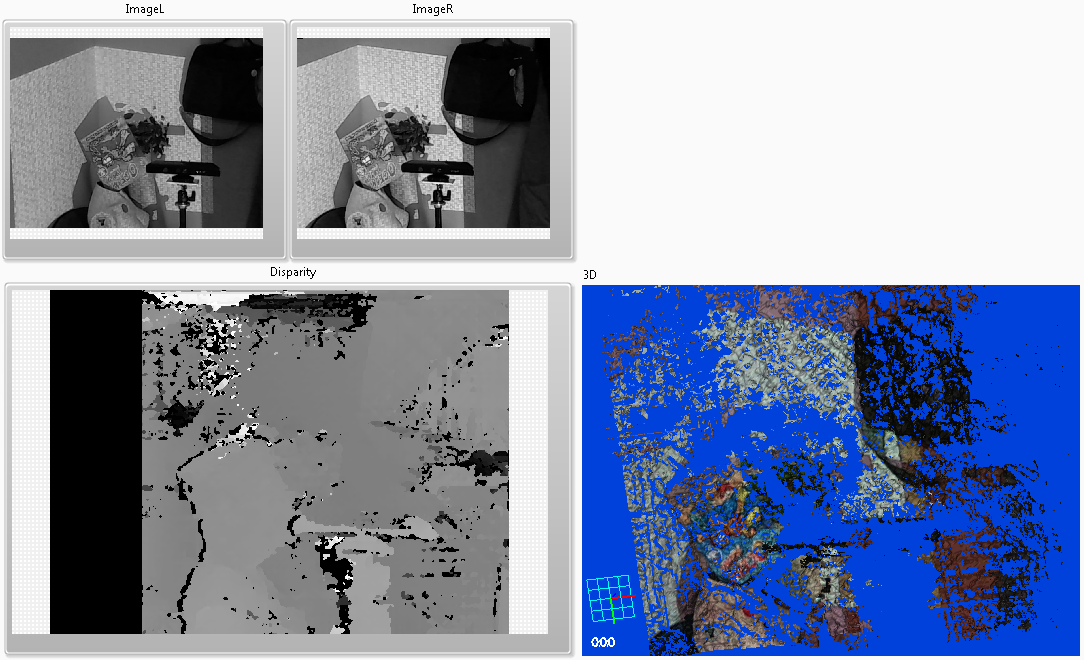
For the purpose of testing the matching algorithms (to obtain the disparity image), I have also used a DLP projector to project a random pattern on the measured scene. This helps to make the correspondence problem a little easier for the regions with less texture. The results are shown in Figures 1-4 below. The rectified images from both cameras, the disparity map (semi global block matching) and the reconstructed 3D surface are shown for OpenCV and Labview, where the measured scene was not illuminated in one case and illuminated with the projector in the other case.

without_projection.png

Figure 1. OpenCV without projection pattern


without_projectionLV.png

Figure 2. Labview without projection pattern


with_projection.png

Figure 3. OpenCV with projection pattern


with_projectionLV.png

Figure 4. Labview with projection pattern


Also, I have achieved 5-10 frames per second performance with OpenCV. I have not yet tested the speed performance of the Labview stereo library. I have also noted some discrepancies in the calibration parameters between both calibration procedures.

I am wondering for some time now if the Labview stereo library is partially (fully?) based on the one form OpenCV? There is definitely a lack in documentation in Labview regarding this, and to my experience the NI support could also be a bit better.

Any comments and experiences regarding this are appreciated.

Best regards,

K

Klemen
7999 Views
3 Comments

Hello,

I am attaching an application (with graphical user interface - GUI) that can be used to register/align a pair of point clouds. Filtering can also be performed prior to the registration process. The application is partially inspired by Geomagic's cloud registration functionality (although my interface is not nearly as fancy ). There are three registration possibilities:

  1. Manual registration, based on manually selecting the corresponding points on two point clouds (using PCL),
  2. Sample consensus initial alignment, based on descriptors that are extracted from the two point clouds (using PCL),
  3. ICP registration, which produces very similar results as the Geomagic's global registration - at least on the datasets I've tested (using trimesh2). The algorithm is fast and more information can be found in the paper "Efficient Variants of the ICP Algorithm" by Rusinkiewicz S and Levoy M. I used the trimesh2 library because I wasn't getting good results with the PCL's ICP algorithm (using the classical ICP from PCL 1.6.0). I have not tried to create my own ICP pipeline as suggested on the PCL forums. Possibly this would provide much better results.

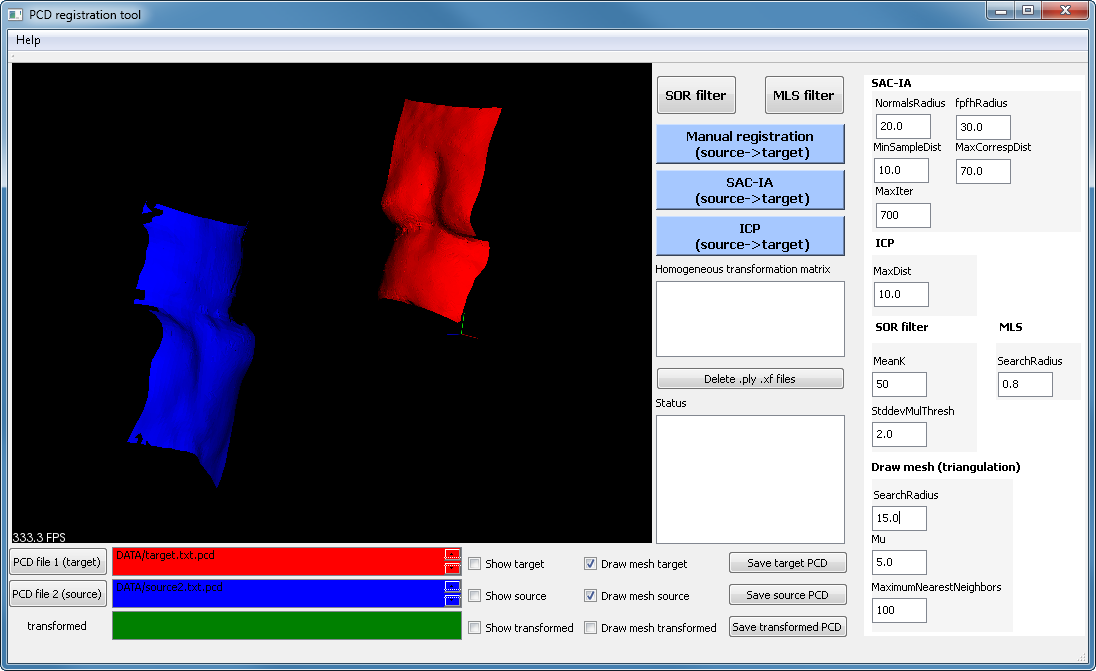
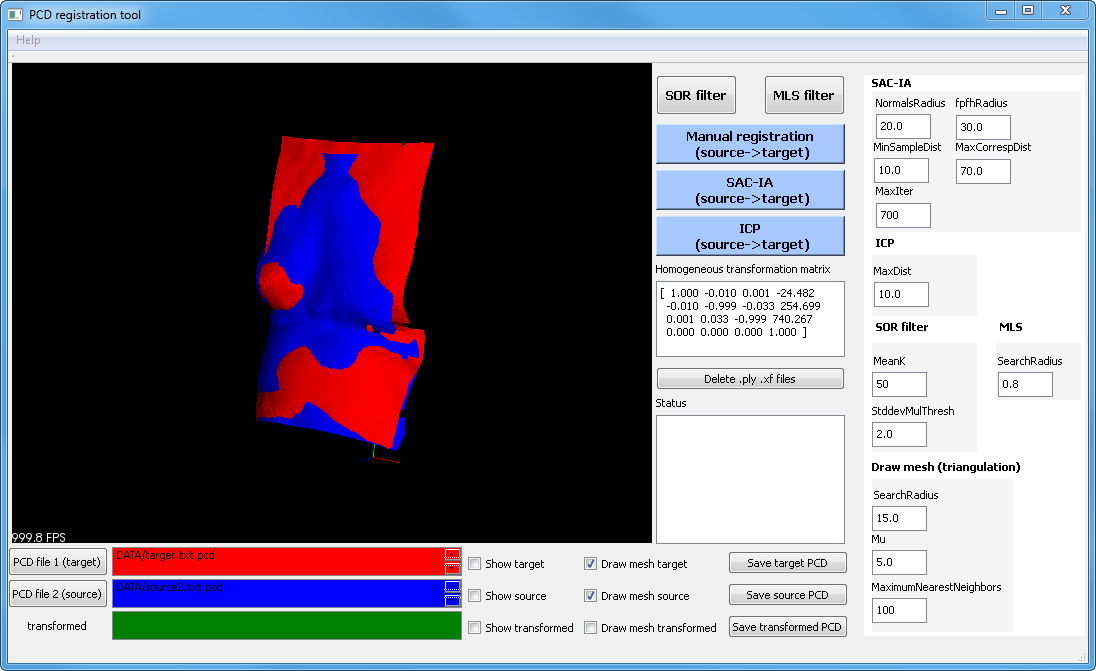
Figure 1 shows the main user interface with two triangulated point clouds that need to be registered.

registrationTool_1.png

Figure 1. Main window of the application.

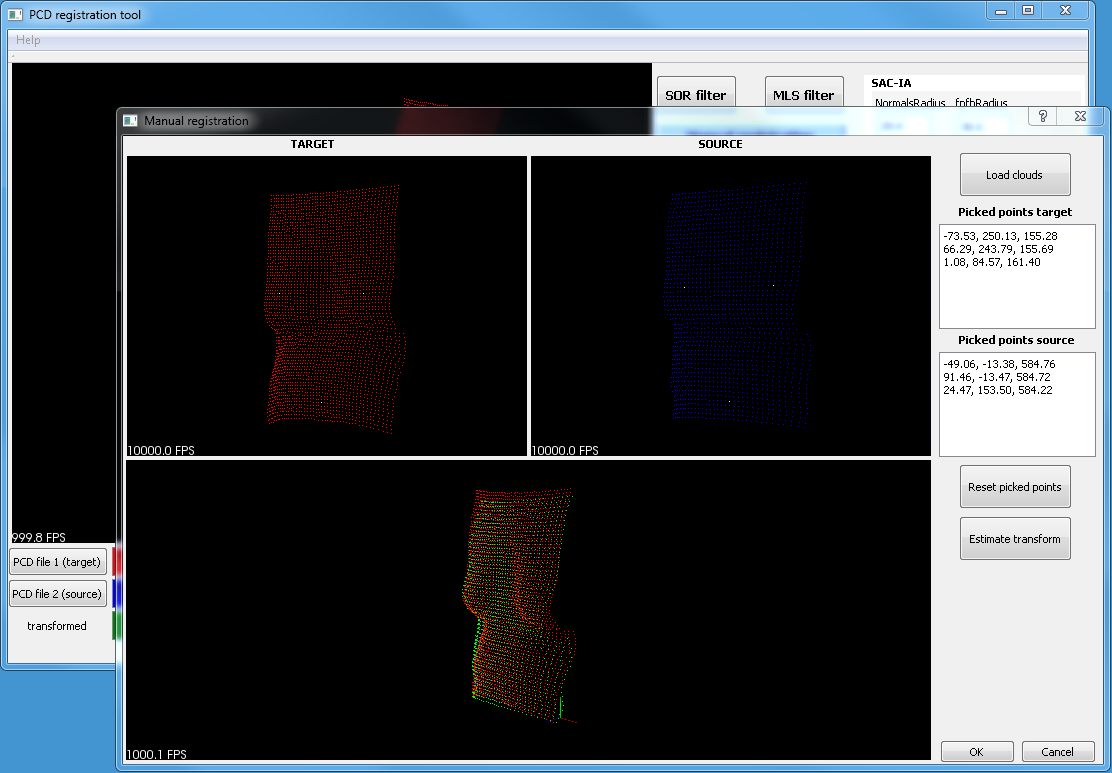
Clouds from Figure 1 cannot be aligned with ICP directly, so some preprocessing is necessary. Figure 2 shows the user interface for manual registration. The transformed cloud based on the manual registration and target  cloud are shown at the bottom of the interface.

registrationTool_2.png

Figure 2. Interface for manual registration.

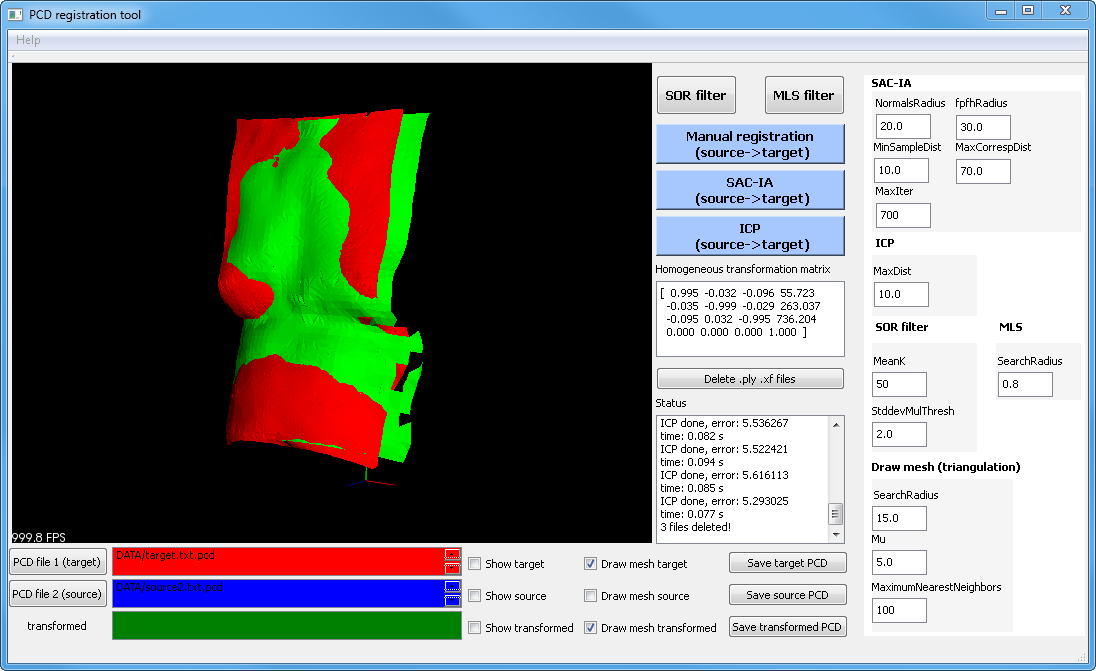
By selecting "OK", the transformation values are passed to the main window and the transformation matrix indicator is updated accordingly (see Figure 3).

registrationTool_3.png

Figure 3. Manual registration.

Performing the ICP improves the result by minimizing the errors and the transformation matrix indicator gets updated (see Figure 4). Multiple ICP routines can be executed by clicking on the ICP button.

registrationTool_4.png

Figure 4. ICP registration.

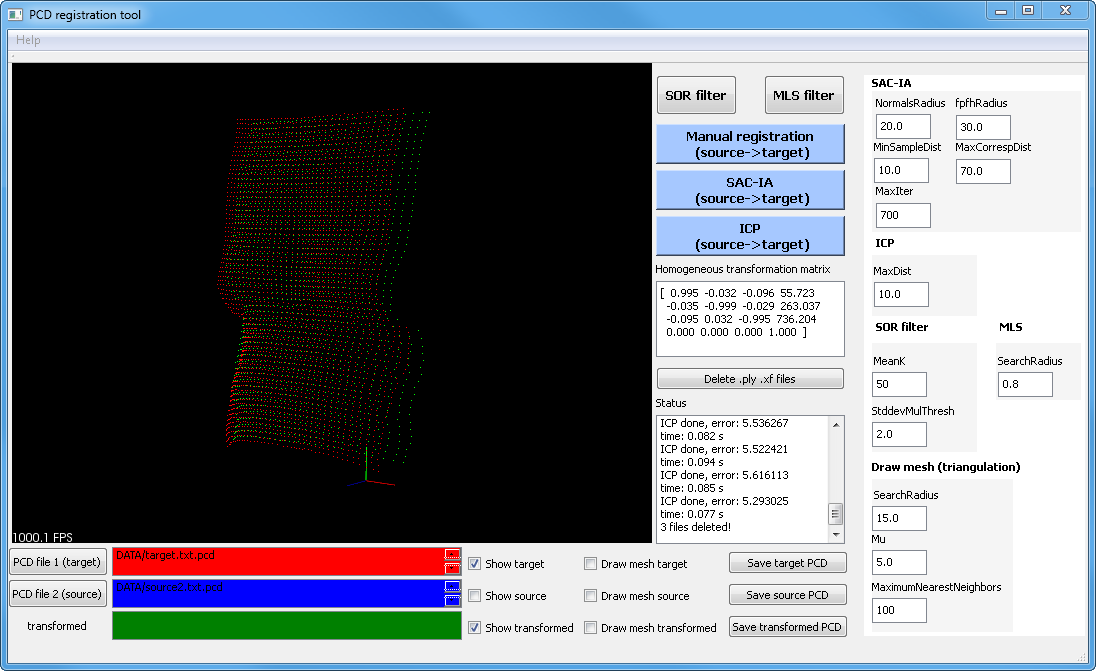
In every step, the clouds can be visualized in main window as points (see Figure 5) or surfaces (see Figures 1,3,4).

registrationTool_5.png

Figure 5. Data from figure 4 visualized as points.

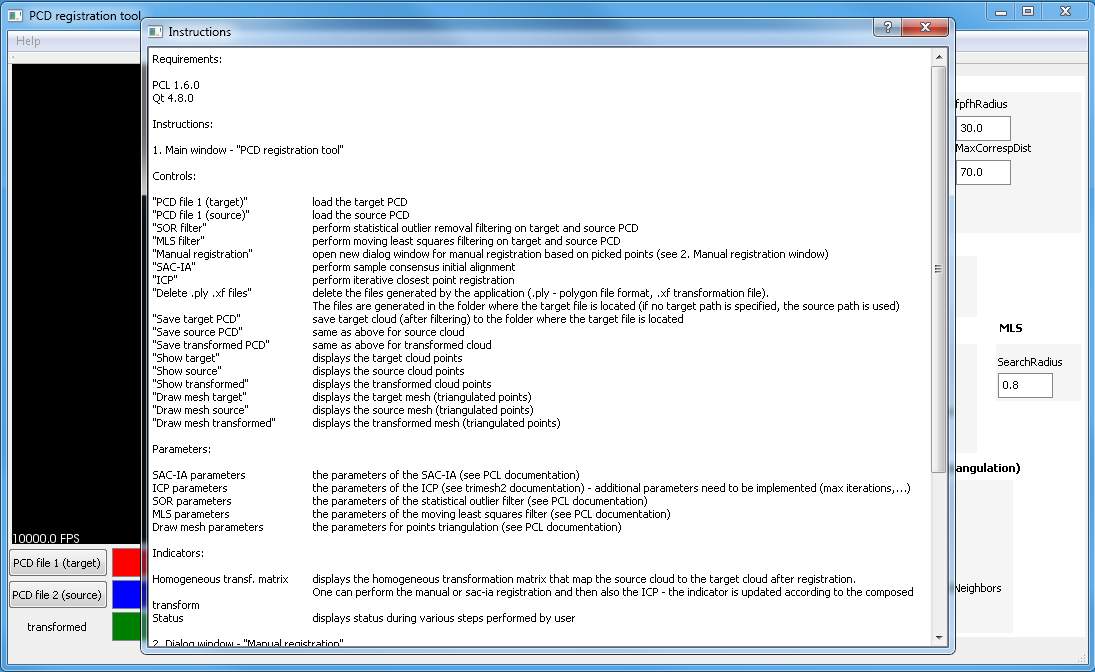
Additional information on the controls and indicators can be found by clicking on the Help->Instructions on the top-left corner of the GUI (see Figure 6).


registrationTool_6.png

The requirements to run the application are PCL 1.6.0 and Qt 4.8.0, where you need to add the "bin" paths to the PATH system variables.

The application is at this time provided as .exe only and can be found in the attached .zip file. The .zip file is password protected in order to potentially avoid the virus scanning during upload. The password is in the attached .txt file.

There are possibly some bugs - if you test the application and have the time, please provide feedback.One of the bugs is related to the manual registration only after re-opening the manual registration window. The picked points are not always displayed on the cloud, although they are registered (see the cmd output window).

P.S.: The input cloud(s) must be in the .pcd format. Example (column 1 - X data, column 2 - Y data, column 3 - Z data):

# .PCD v0.7 - Point Cloud Data file format

VERSION 0.7

FIELDS x y z

SIZE 4 4 4

TYPE F F F

COUNT 1 1 1

WIDTH 3171

HEIGHT 1

VIEWPOINT 0 0 0 1 0 0 0

POINTS 3171

DATA ascii

10.000000    25.000000    -5.000000

11.000000    26.000000    -4.000000

14.000000    29.000000    -1.000000

-112.290000    164.349000    82.436000

-111.669000    159.135000    85.179000

-110.629000    154.515000    91.104000

...                    ...                   ...

Best regards,

K

Download All
Klemen
4377 Views
0 Comments

Hello,

this post shows an example of sequential/animated ICP registration of two point clouds acquired from the Kinect device. This means that every iteration of the ICP algorithm can be observed on the 3D display, until  the max iteration  criteria is satisfied and the registration stops. The max iterations to perform can be modified using the control on the GUI (Figure 1 and Figure 2).  The left 3D indicator on the GUI is used to show Kinect stream, i.e. acquired XYZRGBA point cloud. Any acquired cloud can be added to the right 3D indicator by clicking on the "Add cloud" control. Only two clouds can be added for registration. The button "Remove clouds" removes the clouds from the right 3D indicator. After two clouds are selected, the "Registration" button runs the ICP algorithm one iteration per program loop. This makes it possible to observe the animated registration of two point clouds.

Figure 1 below shows the situation prior to the registration and Figure 2 situation after the registration.

Registration.PNG

Figure 1. Prior to the ICP registration (hand example).

Registration1.PNG

Figure 2. After the ICP registration (hand example).

The results of the registration are shown in the right-bottom indicators of the GUI: the homogeneous transformation matrix, the derived euler angles and translation parameters. Clicking on the "Remove clouds" also clears the indicators.

The video below shows the entire process of registration.

Video 1. Sequential/animated ICP registration of two point clouds.

Video link: https://www.youtube.com/watch?v=k279CssxJBQ&feature=youtu.be


The source code is in the attachment and is provided as is. There is still room for improvement, if needed.

Best regards,

K

Klemen
5971 Views
1 Comment

Hello,

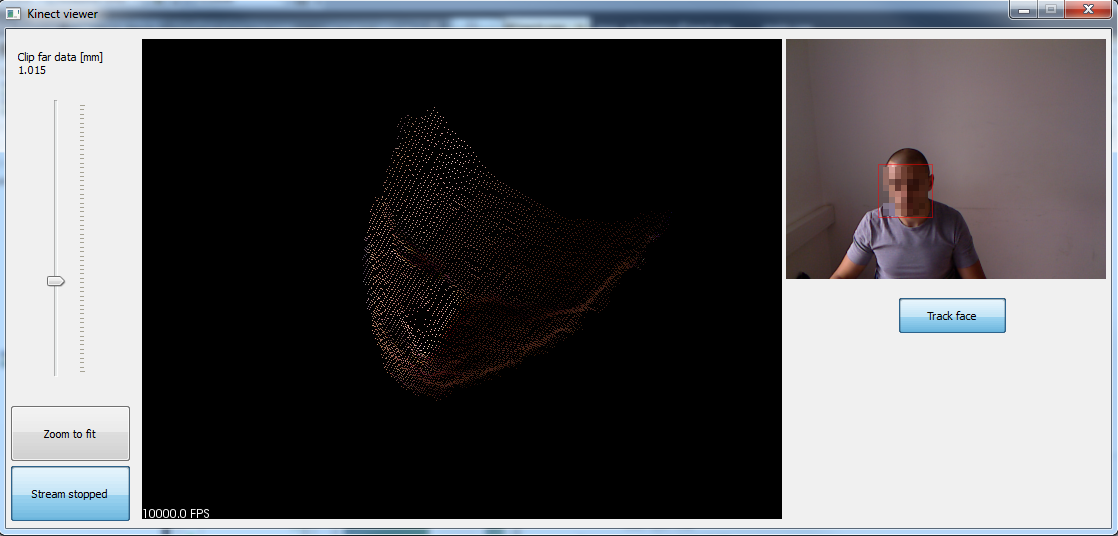
looking at the previous posts, the next logical step is to combine Qt, PCL and OpenCV. With the combination of all three (wow, right ) you can do some amazing stuff in the field of computer vision. I just made the last example, where OpenCV Haar classifier is used to detect the person's face rectangular ROI on the RGB image streamed from Kinect. Next, the detected face ROI indices are used to extract only the face region from the 3D Kinect point cloud. This is shown in Figure 1 below.


QtPCLOpenCV.png

Figure 1. GUI for 3D face detection/tracking.


In order to include OpenCV dependencies, just modify the CmakeLists.txt to add:

find_package (OpenCV REQUIRED) and

${OpenCV_LIBS} in the TARGET_LINK_LIBRARIES section.

The Cmake is probably going to complain about not finding OpenCV, but just add the OpenCV's "build" folder path to the CMakeCache.txt. Run Cmake (from Qt) again.

The source code in the attachment is provided as is.

Best regards,

K

Klemen
14042 Views
2 Comments

Hello,

I have been losing my sleep for the last couple of days trying to get the PCL and Qt working together. And also some additional time to get the Kinect stream/visualization up and running. The result can be seen below in Video 1 where a simple Qt GUI is used to show the Kinect point cloud in real-time with some additional controls to process the data.


Video 1. Qt GUI for Kinect real-time stream visualization.

Video link: https://www.youtube.com/watch?v=_sM5ZMJ0XGA


In order the get the PCL working in Qt, I've made the following steps (tested on x86, Win 7 architecture):

  1. Install binaries PCL 1.6.0 (MSVC 2010) all-in-one (http://pointclouds.org/downloads/windows.html),
  2. install Qt 4.8.0 and Qt creator (https://www.qt.io/download-open-source/),
  3. install Vtk 5.8.0 with Qt support,
  4. install Cmake (http://www.cmake.org/)
  5. follow the instructions to configure and build the project here: http://pointclouds.org/documentation/tutorials/qt_visualizer.php. After trying a lot of other approaches, only this worked. Use the source code and provided CMakeLists.txt,
  6. if you get missing libraries for any dependencies, open CMakeCache.txt in the build directory and manually add the path to the libraries (replace all "NOT FOUND" with appropriate paths, e.g. "C:/Program Files (x86)/PCL 1.6.0/3rdParty/Boost/lib"),
  7. run Cmake from Qt again (see step 5),
  8. open MSVC 2010 and build the project.

Your project should build sucessfully. Note that in the debug version, the frame rate is ~4 Hz, while in release version, the frame rate is ~30 Hz (@ VGA resolution).

If you want to upgrade the GUI, I suggest opening the .pro file in Qt creator, modify and repeat the build process.

The source code is in the attachment. There are two additional files (cloudData.h and cloudData.cpp) that you need to include in your MSVC 2010 project (or your CMakeLists.txt) in order to build the code sucessfully.

Post any comments below.

Best regards,

K

Klemen
5247 Views
0 Comments

Hello,

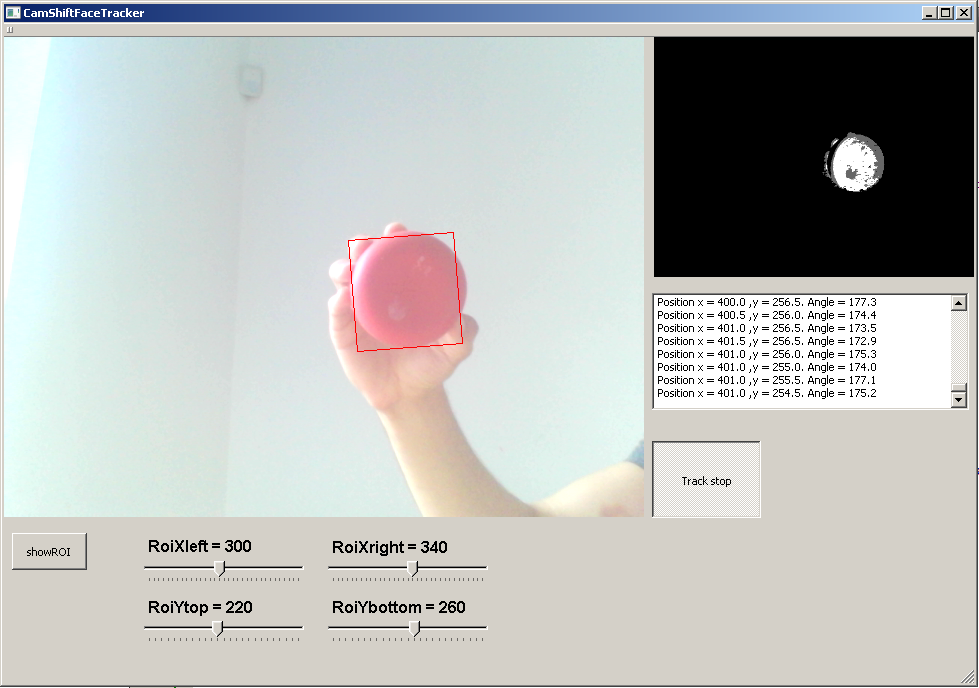
before I move on displaying the data stream from Kinect as promised in the previous post, I have created another GUI example in Qt for OpenCV's CamShift tracking. The GUI shows the camera stream, where it is possible to interactively create a model for histogram backprojection. Based on this, the object is then tracked in real-time.

Figure 1 shows the GUI concept. The controls and indicators don't look very nice, because my Win 7 theme is set to classic.

OpenCVQt_camshift.png

Figure 1. GUI for CamShift tracker

Firstly, the "showRoi" button is used to select the histogram model from image stream, where the ROI position can be modified using the sliders. The backprojection image is also shown for the current ROI. After that, the "Track" button starts the object tracking using the hue-saturation histogram model based on the selected ROI. The backprojection image should have mostly whitish colors that correspond to the tracked object. The indicator below the backprojection image shows the position and the angle of the object.

The code is in the attached .zip file.

In order to get OpenCV working with Qt, check the previous post.

Best regards,

K

Klemen
17699 Views
1 Comment

Hello,

I had some free time and I've decided to test an alternative to Labview GUI for image processing tasks. Many of my previous posts talk about using various OpenCV functionalities in Labview via .dll function calls.This involves some additional (but fairly straightforward) work to properly setup the call library function node. For this example, I used Qt framework (http://www.qt.io/developers/), which uses the standard C++ with some additional functionalities. Qt is mainly used for GUI development, but is also an alternative to Visual Studio (non-qt applications can also be made, such as console applications).

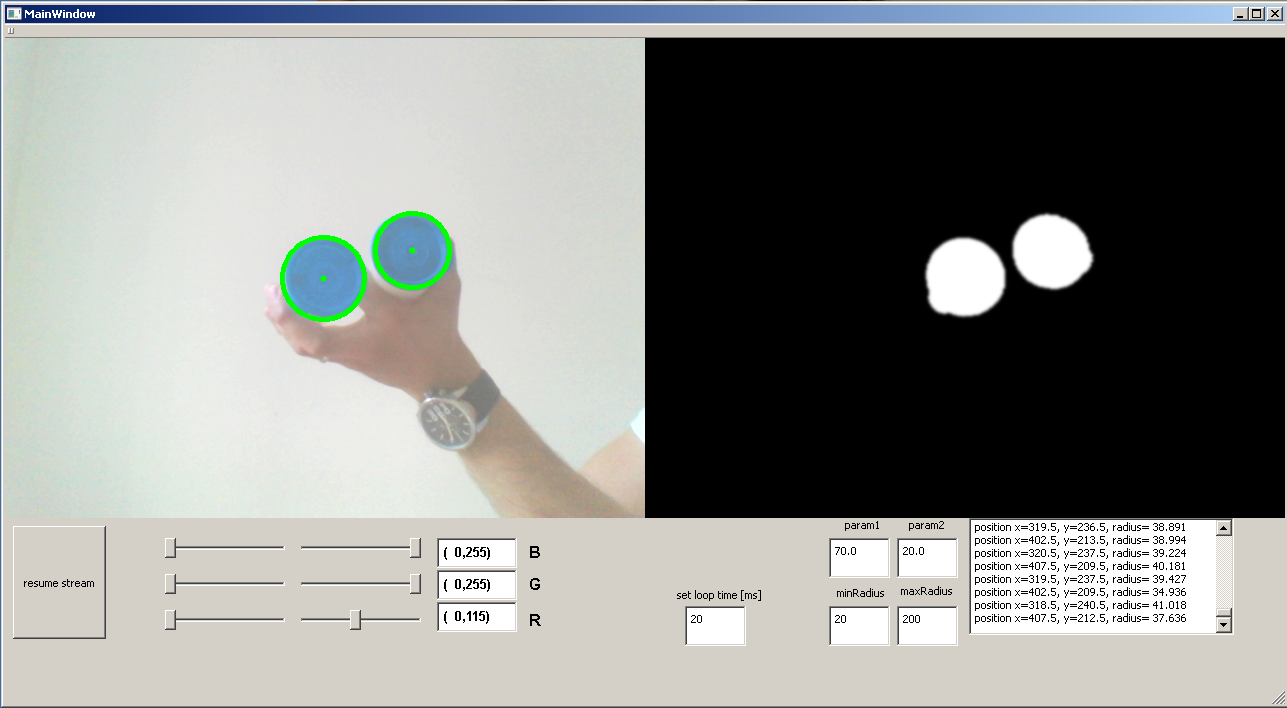
Today, I tested a small program using OpenCV and Qt (community version). The program is basically a GUI with some indicators and controls that can be used to modify a few parameters for real-time object detection using Hough circle transformation. The image below explains this better.

QtOpenCV_example.png

Figure 1. GUI for real-time circle detection visualization.

The horizontal sliders are used modify the threshold of the RGB (BGR) image. This can be used to track object of different colors (I chose the settings based on experimental values). The indicators B,G,R show the threshold ranges for each color plane. Additionally, there are four controls to tweak the circle detection (see OpenCV documentation for further explanation). The parameters can be modified at runtime and are confirmed by pressing the 'enter' or 'return' key. The indicator on the far right shows the position and the radii of the detected circles.

First of all, to get OpenCV working with Qt, you need to include the dependencies, which is in my opinion even easier than in Visual Studio. All include paths go in the same file, which makes the dependencies very readable. See the file with the ".pro" extension in the attachment. Also, add the OpenCV's 'bin' path to system path (straightforward, but if you have problems, see previous posts). The code is in the attachment.

The next thing I will work on is displaying the Kinect data stream (color and depth image and hopefully also 3D).

Best regards,

K

Klemen
11122 Views
6 Comments

Hello,

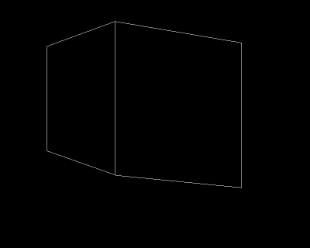
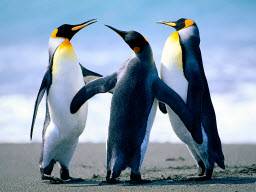
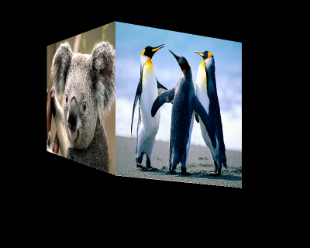
I am posting Labview code to calculate the perspective projective mapping between two planes (homography), assuming that locations of at least 4 corresponding points are known. This can be used for pixel-to-real world mapping by eliminating perspective distortion, after which the measurements of a real world object can be performed. For example, the previous post describes the practical application of this (https://decibel.ni.com/content/blogs/kl3m3n/2015/03/13/optical-water-level-measurements-with-automat...).

Or you can just do some cool stuff like this :

destination_resized.png

base image

Koala_resized.jpgPenguins_resized.jpg

images of koala and penguins (obviously ).

final.png

final image (koala and penguins subjected to perspective distortion and inserted into both base image frames).

I am attaching the Labview program to calculate the homography and perform a simple check of the result. The calculated homography can then be used for example to map the pixel-to-real world or pixel-to-pixel coordinates.

Best regards,

K

Klemen
11235 Views
1 Comment

Hello,

recently, I have been working on a small side project with a colleague, who is involved in a research regarding sustainable technologies in buildings. He wanted autonomous control of the water level in a cylindrical separating funnel with water refill (when the water level drops below a certain threshold). An optical method was chosen to measure and analyze the water level and based on the measurements, a microcontroller was used to control a fish tank pump to refill the water.

To simplify the problem, I separated the design process into the following steps:

  1. System setup (separating funnel positioning, camera selection, lighting, microcontroller and pump),
  2. System calibration (intrinsic camera calibration and perspective projection calibration),
  3. Measurements (conversion of water level height to volume based on the scale of the separating funnel) with automatic water refill and data logging.

1. System setup

To position the separating funnel, a white plastic block was machined on the CNC as shown in Figure 1. The larger groove (running along the entire length of the block) was used to insert the separating funnel in such a way that the outside edge was co-planar to the front surface of the block (important for perspective projection calibration - homography). The four smaller holes were drilled symetrically (also on CNC) and are used for calibration of the perspective distortion (see 2. System calibration).


figure1.png

Figure 1. The model of the plastic block for separating funnel positioning.

The selected camera was a high-end webcamera Logitech C920, with full HD capabilities and Zeiss optics. It's DirectShow compliant and capable of adjusting numerous camera parameters (exposure, focus, contrast, etc...). The characteristics of the camera are:

Resolution: 2304  x 1536 pix

Sensor size:4.80mm x 3.60mm

Focal length: 3.67mm

The dimensions of the plastic block are 150 mm x 150 mm x 60 mm (width, heigth, depth respectively). A rough calculation gives the approximate distance of the camera from the plastic block:

D_H = HFOV * F / SENSOR_WIDTH = 150 mm * 3.67 mm / 4.80 mm ≈ 115 mm 

D_V = VFOV * F / SENSOR_HEIGTH = 150 mm * 3.67 mm / 3.60 mm ≈  150 mm

Taking the larger value, the minimum distance is approximatelly 150 mm. The image resolution along the heigth of the sensor is:

IMAGE_RESOLUTION_V = NOofPIXELS_V / VFOV = 1536 pix / 150 mm ≈ 10 pix/mm.

Since the water level is measured in the vertical direction, we could rotate the camera by 90 degrees to obtain even higher resolution (≈ 15 pix/mm). In this case the camera is not rotated, since the resolution of 10 pix/mm is enough. Remember that the theoretical calculations are only used as a guideline for the camera setup.

The lighting (incandescent light bulb) was positioned on the left and the right side of the camera. There were some interference  problems with the flickering due to the polarity changes of the power supply. This was reduced by modifying  the exposure time of the camera.

A microcontroller (Arduino Uno) was used to drive the fish tank pump via a relay. So, when the water needs to be refilled (detected by the optical system), a signal is sent to the microcontroller using the RS232, which in turn controls the relay. When the water level reaches a defined upper threshold, the pump is disabled.

2. System calibration

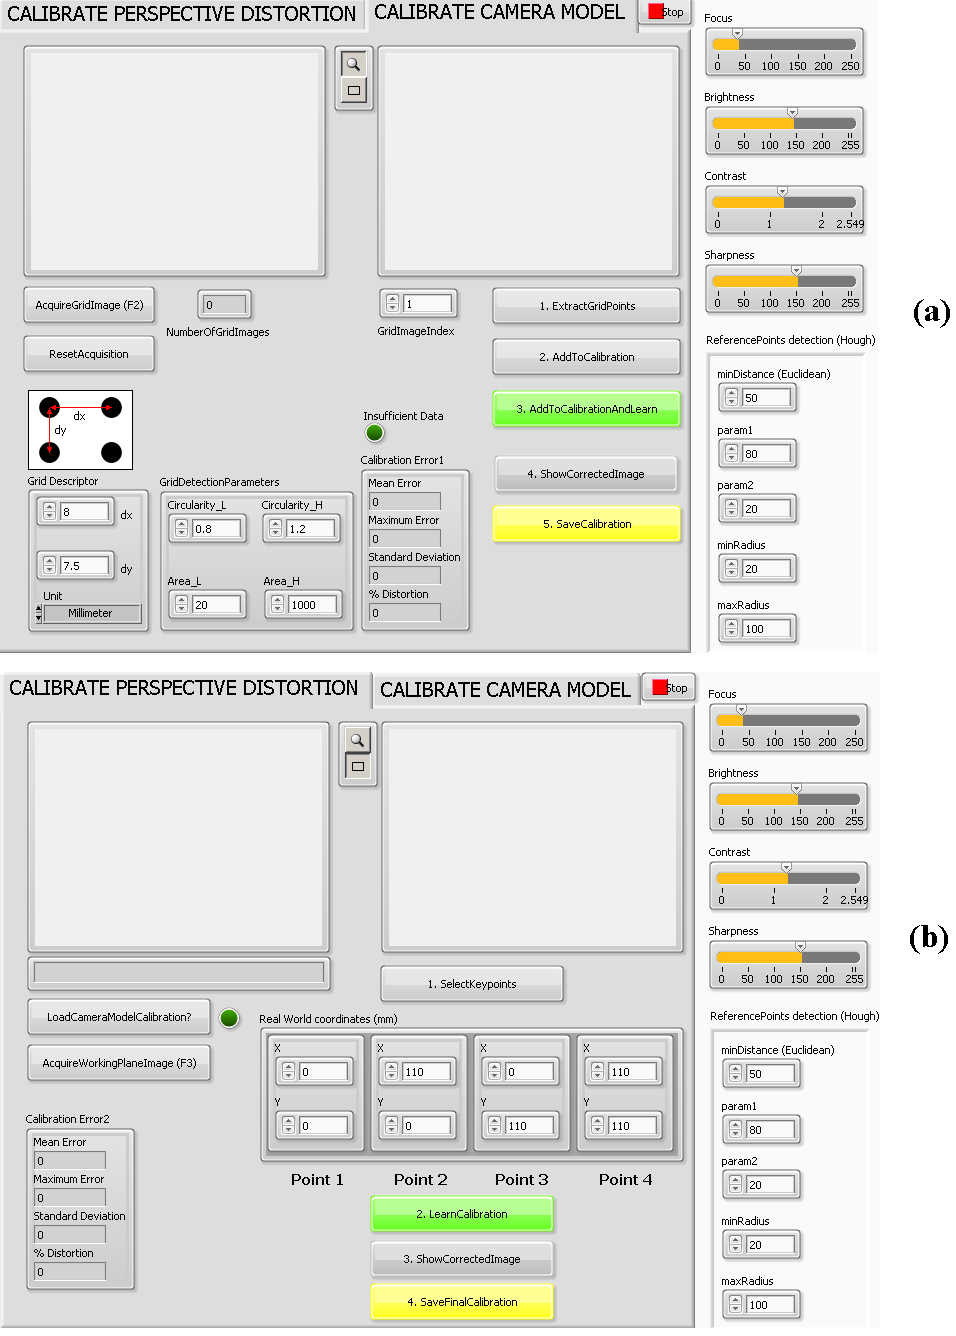
In order to achieve accuracy of measurements, the optical system needs to be calibrated. Eventhough the lens distortion is not significant, the intrinsic camera calibration was still performed using a grid dot pattern. A calibration interface was developed for this purpose (see Figure 2a).


figure2.png                        

Figure 2. The camera calibration interface; intrinsic camera calibration (a) and perspective camera calibration (b).

After the intrinsic camera calibration, the plastic block with the separating funnel and the camera are attached to a pedestal in such a way that the relative position between them is constant. This is important for the perspective calibration, which is based on plane-to-plane homography. At least four corresponding points are needed to solve the homography problem (or more for minimization approach). For this reason, the four drilled holes (see Figure 1) are used as the anchor points for perspective distortion correction. Their real-word distance  (center to center) is known, so they need to be detected on the image also. Hough circle detection is used to extract the image coordinates of the holes centers and finally the perspective distortion is corrected.

3. Measurements

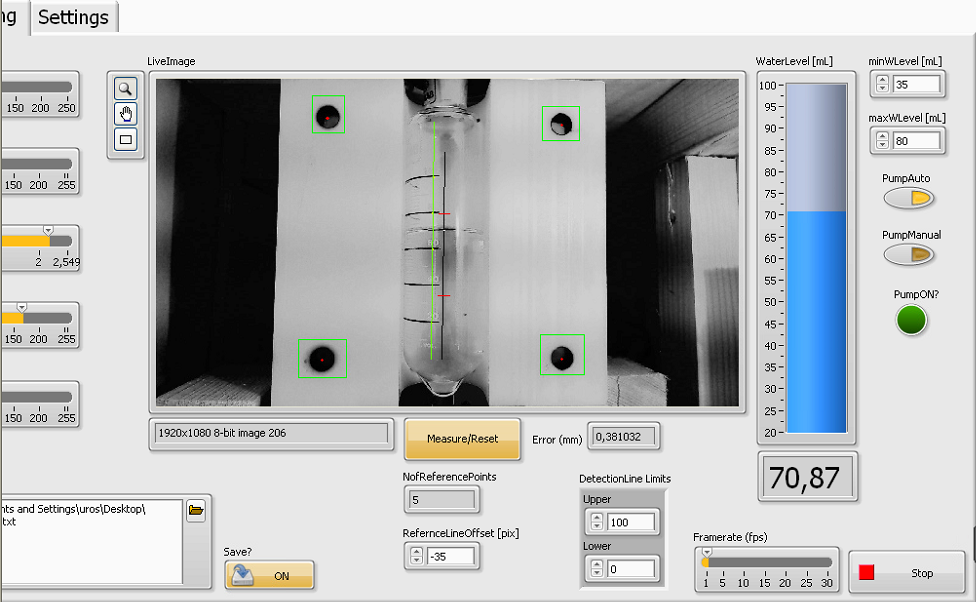
The  measurements are based on the edge detection of water level and the separating funnel scale at every 20 mL. In the first step (performed only once), the horizontal lines of the scale are detected and the heigth-to-volume conversion function is obtained (using a 3rd order polynomial fit). This makes it possible to calculate the volume of the liquid based on the reference scale of the separating funnel. Figure 3 shows the measurement interface (a part of the interface on the left is missing due to the image croping). Along the two vertical lines (green and black) the edge detection is performed. The black line is used for water level detection and the green line for the detection of the separating funnel scale at 20 mL interval. The shorter horizontal lines (red) are the upper and the lower threshold, which are used to consequently turn on/off the water pump. The shortest horizontal line (white) shows the detected water level.

figure 3.png

Figure 3. The water level measurerment interface.

The image shown in Figure 3 is not rectified (without perspective correction), since this happens in the background only on the relevant pixels. The control "PumpAuto" is used to enable automatic water refill. If necessary, the water can also be manually refilled by the "PumpManual" control. The error indicator shows the average root mean square deviation of the distances between the four holes (using known distance as a reference, i.e. 110 mm).

Lastly, a consumer-producer architecture is used to save the water level (volume) at discrete time intervals along with the current time.

The application has been running  for about a month now and it performs robustly and reliably so far. The colleague seems to be happy  and I get to write another post after a long time .

P.S.: The user interfaces could be a little neater, but considering that this was just a side/hobby project, it turned out pretty well I guess.

Best regards,

K

Klemen
15183 Views
2 Comments

Hello,

the idea of using a Kalman filter for object tracking is to attenuate the noise associated with the position detection of the object based on estimating the system state. It can also be used to predict the position based on the state transition model when no new measurements are available. The Kalman filter has two phases - the prediction and the correction phase. In order to familiarize yourself with the Kalman filter, I recommend reading the following paper:

"An Introduction to the Kalman Filter" by Greg Welch and Gary Bishop.

There are also numerous other resources regarding the Kalman filter online (for example: http://bilgin.esme.org/BitsBytes/KalmanFilterforDummies.aspx), so I will not dwell on the mathematics behind the algorithm.

In order to use the Kalman filter, the object must be moving with constant velocity or accerelation (depends on the state transition model). The example I am showing here uses a constant velocity model, although you can rebuild the C++ code to consider the constant accerelation model (see the attached C++ code). Remember to modify the parameters of the Kalman object constructor in addition to the state transition model, when alternating between the constant velocity and accerelation models.

Below is the mouse tracking example (see the attachment for the code):

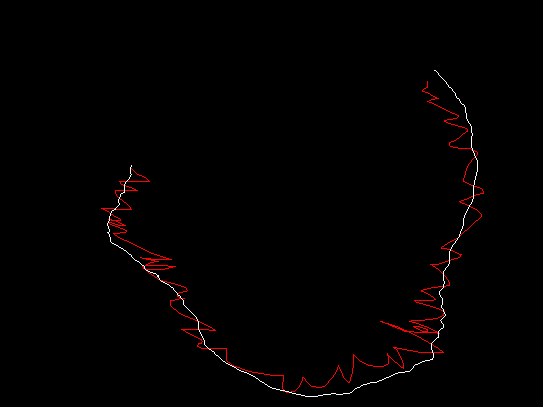
test2.png

Figure 1. Kalman mouse tracker (red curve - the mouse position, white curve - corrected/estimated state)

Additionally, I've implemented the Kalman filter on meanshift object tracking (see the attachment for the code):

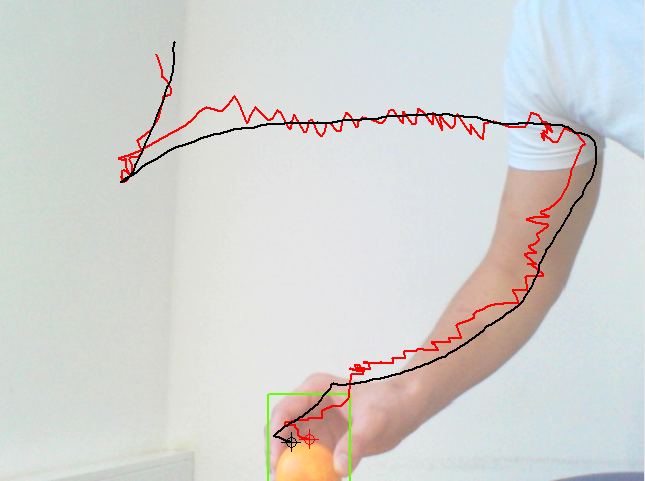
test1.png

Figure 2. Object tracking using meanshift and Kalman filter (red curve - meanshift algorithm, black curve - corrected/estimated state).

The Kalman filter is the OpenCV's (2.4.9) implementation, called in Labview (2013) as a .dll. I am attaching the C++ source code, the .dll and the two examples shown in the two figures above. There are some additional comments in the code.

Hope this helps someone.

Best regards,

K

Klemen
9478 Views
9 Comments

Hello,

today I am posting a full example on how to receive data in Labview that is sent from a microcontroller. The microcontroller I used for testing was Arduino Uno (the posted code reflects this), but in case anyone wants to use ARM based microcontroller (STM32 line, ARM Cortex-M) please let me know and I will update the code.

The microcontroler sends random byte data to the serial port and also calculates a 2 byte CRC which is appended after the end of each data package. Of course, the data sent can be anything - for example, the data read from an arbitrary sensor. You can modifiy the number of bytes sent and the number of bytes that are used to signal the data end (for explanation, see the full code below):


class GenerateAndSend {

  public:

    uint8_t data;

    uint16_t crc_16;

    static const uint8_t streamEnd;

  public:

    GenerateAndSend(void);

    ~GenerateAndSend(void);

    void Reset(void);

    void GenerateDataAndSend(uint8_t downLimit, uint8_t upLimit);

    void SendEnd(void);

    void SendCRC(void);

    void CalculateCRC(uint16_t *pcrc, uint8_t *pdata);

};

const uint8_t GenerateAndSend::streamEnd(255);

GenerateAndSend::GenerateAndSend(void) { 

}

GenerateAndSend::~GenerateAndSend(void) {

}

void GenerateAndSend::Reset(void) {

  crc_16 = 0xFFFF; 

}

void GenerateAndSend::GenerateDataAndSend(uint8_t downLimit, uint8_t upLimit) {

  data = (byte) random(downLimit, upLimit);

  Serial.write(data);

}

void GenerateAndSend::SendEnd(void) {

   Serial.write(streamEnd); 

}

void GenerateAndSend::SendCRC(void) {

  uint8_t *pcrc_16 = (uint8_t*) &crc_16;

  for(uint16_t i=0;i<2;i++,pcrc_16++) {

    Serial.write((*pcrc_16));

  }

}

void GenerateAndSend::CalculateCRC(uint16_t *pcrc, uint8_t *pdata) {

  // Fast (LUT) CRC16 calculation update (one call, one byte)

  // Byte table 0xA001 polynomial   

  static const uint16_t crc16_tbl[] = {0x0000, 0xC0C1, 0xC181, 0x0140, 0xC301, 0x03C0, 0x0280, 0xC241,

                       0xC601, 0x06C0, 0x0780, 0xC741, 0x0500, 0xC5C1, 0xC481, 0x0440,

                       0xCC01, 0x0CC0, 0x0D80, 0xCD41, 0x0F00, 0xCFC1, 0xCE81, 0x0E40,

                       0x0A00, 0xCAC1, 0xCB81, 0x0B40, 0xC901, 0x09C0, 0x0880, 0xC841,

                       0xD801, 0x18C0, 0x1980, 0xD941, 0x1B00, 0xDBC1, 0xDA81, 0x1A40,

                       0x1E00, 0xDEC1, 0xDF81, 0x1F40, 0xDD01, 0x1DC0, 0x1C80, 0xDC41,

                       0x1400, 0xD4C1, 0xD581, 0x1540, 0xD701, 0x17C0, 0x1680, 0xD641,

                            0xD201, 0x12C0, 0x1380, 0xD341, 0x1100, 0xD1C1, 0xD081, 0x1040,

                       0xF001, 0x30C0, 0x3180, 0xF141, 0x3300, 0xF3C1, 0xF281, 0x3240,

                       0x3600, 0xF6C1, 0xF781, 0x3740, 0xF501, 0x35C0, 0x3480, 0xF441,

                       0x3C00, 0xFCC1, 0xFD81, 0x3D40, 0xFF01, 0x3FC0, 0x3E80, 0xFE41,

                       0xFA01, 0x3AC0, 0x3B80, 0xFB41, 0x3900, 0xF9C1, 0xF881, 0x3840,

                       0x2800, 0xE8C1, 0xE981, 0x2940, 0xEB01, 0x2BC0, 0x2A80, 0xEA41,

                       0xEE01, 0x2EC0, 0x2F80, 0xEF41, 0x2D00, 0xEDC1, 0xEC81, 0x2C40,

                       0xE401, 0x24C0, 0x2580, 0xE541, 0x2700, 0xE7C1, 0xE681, 0x2640,

                       0x2200, 0xE2C1, 0xE381, 0x2340, 0xE101, 0x21C0, 0x2080, 0xE041,

                       0xA001, 0x60C0, 0x6180, 0xA141, 0x6300, 0xA3C1, 0xA281, 0x6240,

                       0x6600, 0xA6C1, 0xA781, 0x6740, 0xA501, 0x65C0, 0x6480, 0xA441,

                       0x6C00, 0xACC1, 0xAD81, 0x6D40, 0xAF01, 0x6FC0, 0x6E80, 0xAE41,

                       0xAA01, 0x6AC0, 0x6B80, 0xAB41, 0x6900, 0xA9C1, 0xA881, 0x6840,

                       0x7800, 0xB8C1, 0xB981, 0x7940, 0xBB01, 0x7BC0, 0x7A80, 0xBA41,

                       0xBE01, 0x7EC0, 0x7F80, 0xBF41, 0x7D00, 0xBDC1, 0xBC81, 0x7C40,

                           0xB401, 0x74C0, 0x7580, 0xB541, 0x7700, 0xB7C1, 0xB681, 0x7640,

                       0x7200, 0xB2C1, 0xB381, 0x7340, 0xB101, 0x71C0, 0x7080, 0xB041,

                       0x5000, 0x90C1, 0x9181, 0x5140, 0x9301, 0x53C0, 0x5280, 0x9241,

                       0x9601, 0x56C0, 0x5780, 0x9741, 0x5500, 0x95C1, 0x9481, 0x5440,

                       0x9C01, 0x5CC0, 0x5D80, 0x9D41, 0x5F00, 0x9FC1, 0x9E81, 0x5E40,

                       0x5A00, 0x9AC1, 0x9B81, 0x5B40, 0x9901, 0x59C0, 0x5880, 0x9841,

                       0x8801, 0x48C0, 0x4980, 0x8941, 0x4B00, 0x8BC1, 0x8A81, 0x4A40,

                       0x4E00, 0x8EC1, 0x8F81, 0x4F40, 0x8D01, 0x4DC0, 0x4C80, 0x8C41,

                       0x4400, 0x84C1, 0x8581, 0x4540, 0x8701, 0x47C0, 0x4680, 0x8641,

                       0x8201, 0x42C0, 0x4380, 0x8341, 0x4100, 0x81C1, 0x8081, 0x4040};   

  (*pcrc) = ( (*pcrc) >> 8 ) ^ crc16_tbl[( (*pcrc) & 0xFF ) ^ (*pdata)]; // Process 8-bits at a time   

}

GenerateAndSend streamData; // Object

void setup() {

  Serial.begin(115200);

}

void loop() {

  streamData.Reset();

  for(uint16_t i=0;i<5;i++) { // Data

    streamData.GenerateDataAndSend(0, 255);

    streamData.CalculateCRC(&streamData.crc_16, &streamData.data);

  }

  for(uint16_t i=0;i<3;i++) { // Send End (number of times must be synchronized with the receiver)

    streamData.SendEnd();

    streamData.CalculateCRC(&streamData.crc_16, (uint8_t*) &streamData.streamEnd);   

  }

  streamData.SendCRC(); // Send calculated CRC

  delay(100); // Delay

}

I tend to separate the class declaration and members definition in different files (.h and .cpp), but this example is simple and more readable this way.

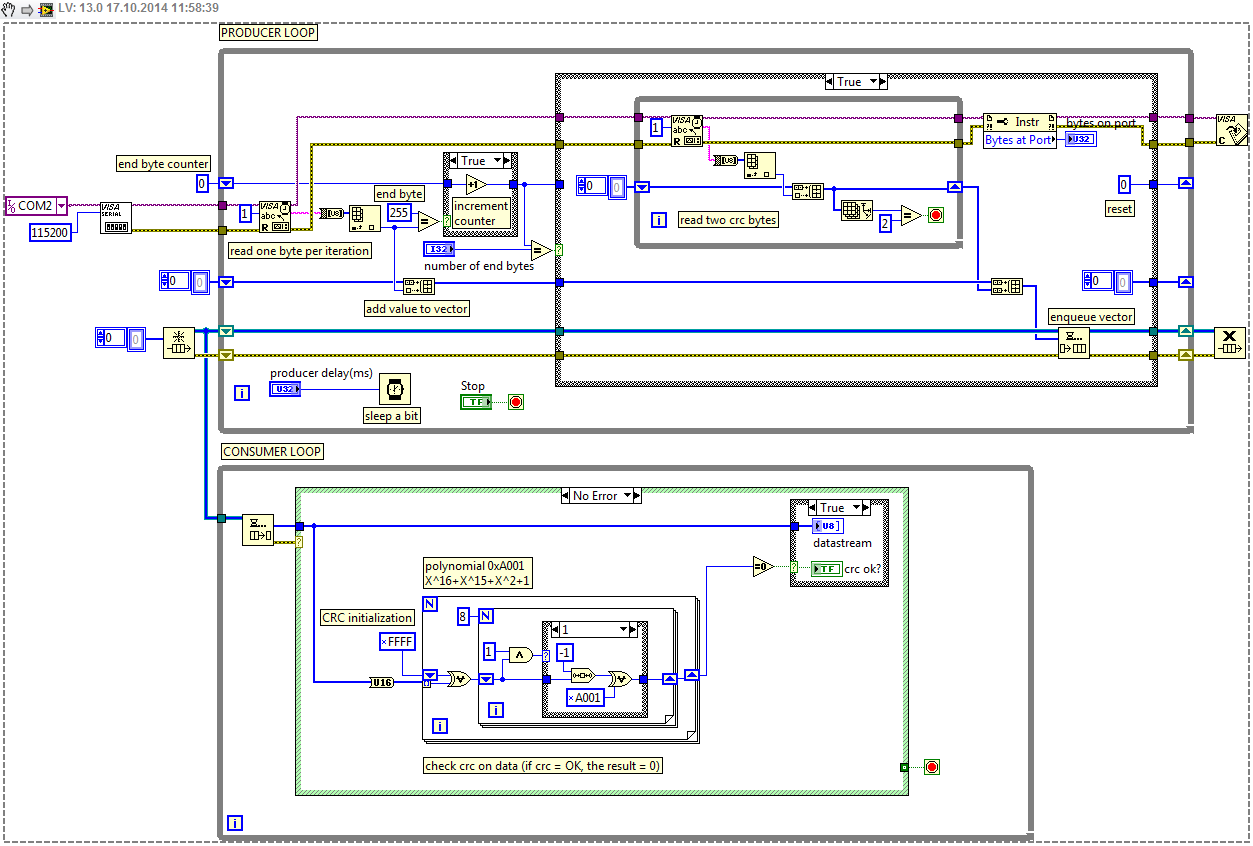
The Labview code uses a producer, consumer structure. The producer loop reads one byte at a time and checks for data package end. When the data package end is recognized, two additional bytes are read (the CRC). The consumer loop then performs the CRC check and outputs the data stream.

readCOMdatastream_BD.png

The Labview code could be made more readable by packing some portions into subvi's, but  it seemed simpler to present the example in this manner.

I am also attaching the C++ code for Arduino as a .txt/.ino file and the Labview code saved for version 2013. Again, if someone needs the ARM code, please let me know and I will update the post.

Best regards,

K

Download All
Klemen
11392 Views
3 Comments

Hello everybody,

this post is a Labview code example on how perform image segmentation using the K-means clustering algorithm from the Labview Machine Learning Toolkit. This excellent and useful toolkit can be found here:

https://decibel.ni.com/content/docs/DOC-19328

I have used the Matlab example as a reference for the segmentation, which can be found here:

http://www.mathworks.com/help/images/examples/color-based-segmentation-using-k-means-clustering.html

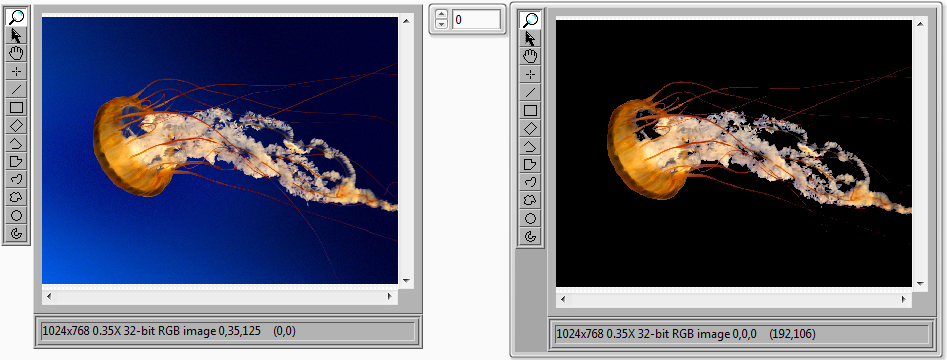
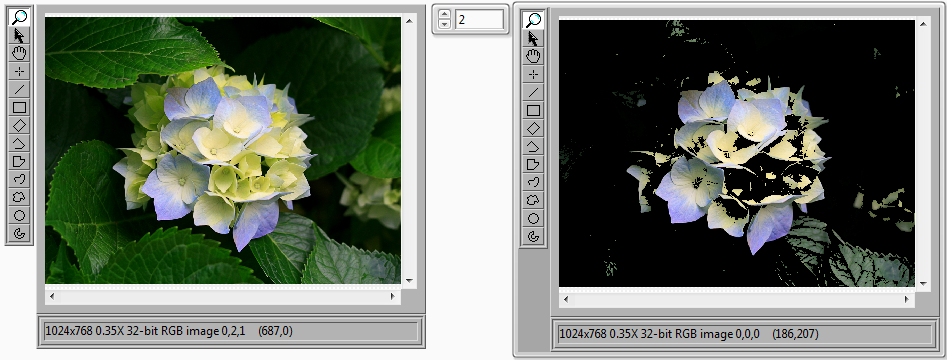
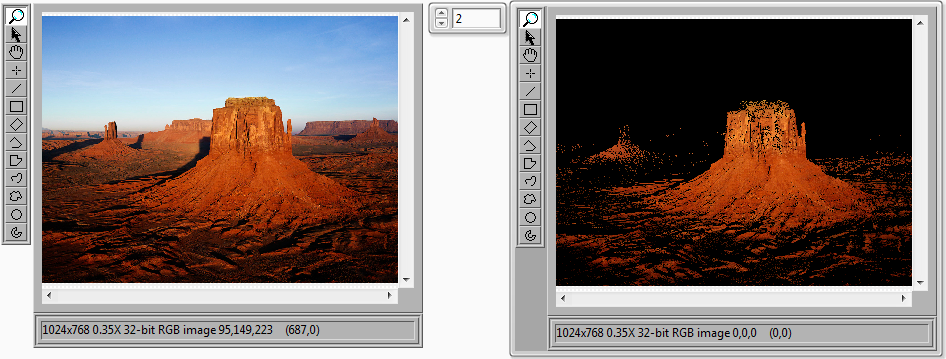
The objects in the image were separated into three clusters. The results for Matlab and Labview implementation are shown below.

                                Matlab                                                           Labview

KMeansSegmentationExample_04.png  1.png

KMeansSegmentationExample_05.png  2.png

KMeansSegmentationExample_03.png  3.png

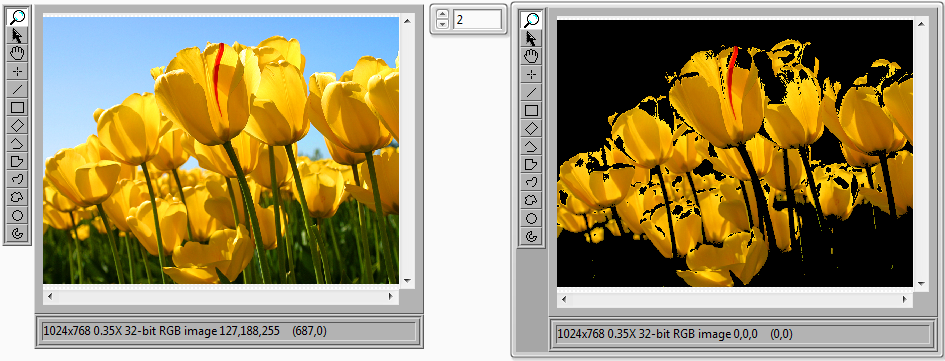
Some variation can be seen between the examples, so some further testing needs to be performed in order to pinpoint the discrepancies. But in any case, fairly good segmentation results can be achieved. Below are some examples:

test1.png

test2.png

test3.png

test4.png

or the background:

test5.png

The Labview code is in the attachment (saved for Labview 2013). Eventhough my contribution is not great (majority of the credit goes to the Labview Machine Learning Toolkit), I hope this helps someone somewhere along the way...

Best regards,

K

Klemen
30031 Views
53 Comments

Hello,

this post will be extremely brief. I am putting together some  PCL (http://pointclouds.org/) and OpenCV (http://opencv.org/) functions that can be used in Labview directly via a .dll function call. So far, the following functionalities are implemented in Labview (there is a .vi in the toolkit that returns the current version of the toolkit):

PCL:

- downsample filter

- moving least squares filter

- statistical outliers removal filter

- passthrough filter

- kinect OpenNI based grabber (QVGA and VGA resolution)

- range image from point cloud

- sample consensus rough alignment and icp registration

- point cloud visualizer

- point cloud visualizer with real-tme redraw

OpenCV:

- bilateral filter

- face detection (Haar classifier) and eye detection (Haar classifier)

- grab cut segmentation

- histogram image matching

- histogram of oriented gradients human (pedestrian) detection

- Hough circles detection

- SURF real-time tracking

- template matching

- Shi-Tomasi corner detector

- Harris corner detector

- subpixel corner refinement

- Kalman filter/tracking (constant velocity and constant acceleration model)

- Hough lines detection

- Hough lines detection (probabilistic)

- histogram back projection (hue-saturation histogram backprojection)

- box filter

- Gaussian filter

- median filter

- Canny edge detection

- Sobel edge detection

- Scharr edge detection

- meanshift tracking (hue-saturation histogram backprojection)

- camshift tracking (hue-saturation histogram backprojection)

- face/object tracking (goodFeaturesToTrack->opticalFlow->similarity transform)

- stereo calibration and measurement

THERE ARE ALSO LABVIEW EXAMPLES FOR ALL ABOVE IMPLEMENTED FUNCTIONALITIES. The attached file named "PCL_OpenCV_LabviewToolkit_x64.zip" contains the .dll which is compiled agains x64 libraries. This .dll will not be updated as frequently as the toolkit (which is compiled against x86). In order to get it working, you need to relink the .dll paths.

Both PCL and OpenCV libraries are really extensive, so I plan to add some additional functions as the time goes by (no timeframes, since this is a hobby project).

To make things more simple and clear, all functions listed above have a corresponding example in Labview. The Labview code is in some cases a bit messy, but I do not have the energy nor the time to also make it look pretty. The most important thing is that all the examples have been tested and are 100% working. There are some issues with the PCL visualizers, so always close the visualizer window first and only then stop the Labview program. If you close a program that uses the visualizer functionality, close Labview also and restart the program/project.

The .dll's  were built using PCL 1.6.0 and OpenCV 2.4.9, so you need to have both. Also, please report in the comments box if the examples are working with other versions of PCL and/or OpenCV. If anybody cleans up the examples further, please let me know, so I can make modifications that will make things even more clear for potential users.

I have packed the toolkit with the JKI VI package manager, so you need to download it from:

http://jki.net/vipm

to be able to install the toolkit. This adds the toolkit to the block diagram pallete and simplifies things. There is also an addon that is not packed, since I was having some issues. I am talking ablout the 3D visualizer with real-time redraw, so in order to use it, you would need to manually add the function to your project via the "Select a VI" option on the block diagram pallete.

Also, if you are having any other issues, please report them in the comment box below.

P.S.: Some paths of the addon might be broken, but just point to them manually.

I HAVE REBUILT THE TOOLKIT USING OpenCV 2.4.9.

Also, you need to add the "bin" paths to the environment variables in order for the toolkit to work. In my case:

C:\Program Files (x86)\PCL 1.6.0\bin

C:\Program Files (x86)\OpenCV 2.4.9\opencv\build\x86\vc10\bin

Best regards,

K

P.s: There was some problem with the SURF tracking example (and coding), which was fixed 20.4.2015. If anyone experiences errors, download the toolkit again. All examples were tested.

Download All
Klemen
5166 Views
8 Comments

Hello,

the following post is dedicated to calculation of 3D coordinates using the stereo concept for a scene point that is seen by both cameras. The Labview stereo vision library basically lacks the capability (or maybe I should say a function) to extract the 3D information from an arbitrary point. Instead it uses the block matching algorithms to obtain the disparity over the entire measuring range. This significantly slows down the 3D reconstruction process even though sometimes only a few points are relevant for the mesurements.

I am attaching a program that briefly explains the method behind stereo calculation for a single point. Two different calculations are shown: 1. using the Q matrix (perspective transformation matrix) to obtain the 3D coordinates and 2. using step-by-step calculation. In both cases, the results are the same.

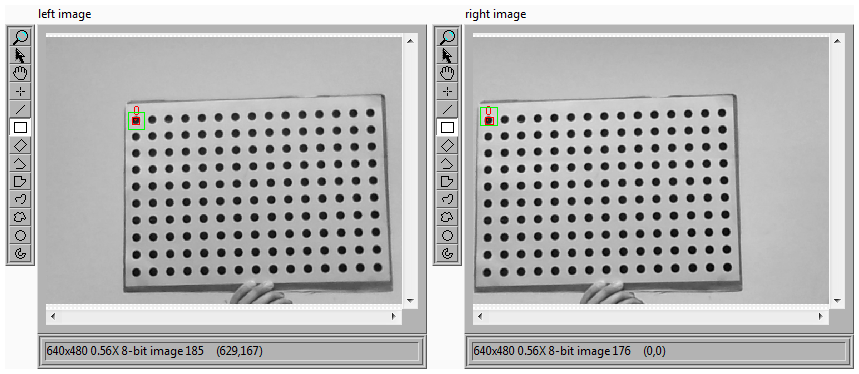
Prior to any measurements system calibration needs to be performed, which is not covered by this post (see: https://decibel.ni.com/content/blogs/kl3m3n/2013/07/26/stereo-setup-parameters-calculation-and-labvi... and the stereo calibration in the NI Vision example folder). For the actual measurements after the calibration, I've used the same calibration board (see Figure 1 below) to extract all dots and calculated their 3D position.

3d_from_stereo_FP.png

Figure 1. Calibration board from the left and the right camera.

The 3D position of the dots is shown in Figure 2, along with the coordinates of the four points I've selected (the units are in mm).

3d.png

Figure 2. 3D reconstruction of grid pattern dots.

I've also calculated the Euclidean distance between the measured points and compared them with the actual distance on the calibration board. The distances between points Pt1, Pt2 and Pt3 differ for less than 1mm, while the difference between Pt1 and Pt4 is approximately 5mm. Mind that this is not the proper way to evaluate the measuring accuracy (for one thing, the board is flat), but gives some basic idea about the results (they are not way off, for example ).

The program attached is saved for Labview 2012. The code is messy, but I have no time to optimize it. If somebody finds it useful, I am certain that he/she will need to perform some modifications (for example, the method for the object detection on images from both cameras).

Best regards,

K

Klemen
6776 Views
12 Comments

Hello,

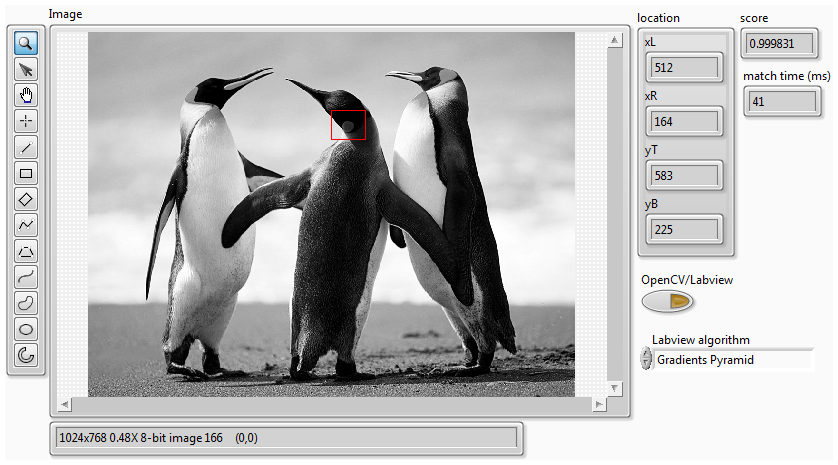
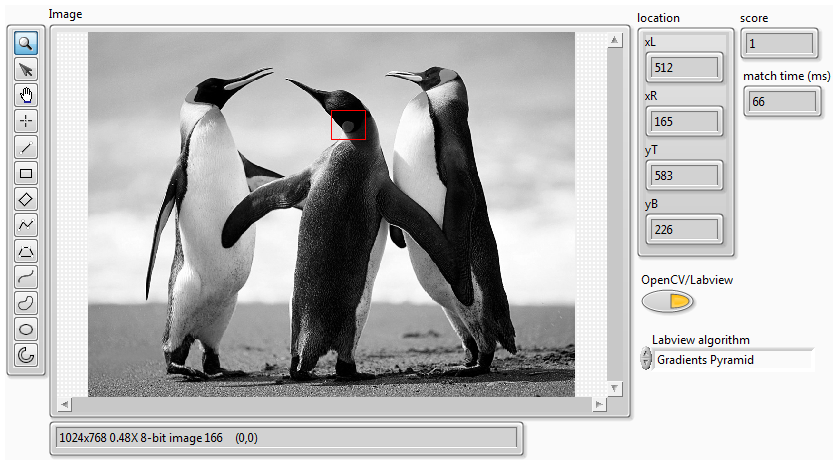
I have come across some questions about the template/pattern matching algorithms in Labview and OpenCV. Mainly about the performance comparison of the algorithms. So, to possibly answer the questions and give people some basic material for further testing, I have prepared a Labview application to compare both algorithms.I have tested this just briefly using one sample image (see below, first image for Labview and the second for OpenCV):

Labview

Labview.png

OpenCV

OpenCV.png

Based on this image only:

- the score is better in OpenCV (it is true that no pyramid downsampling was performed).

- the execution is faster in Labview (again, it is true that no pyramid downsampling was performed)

- OpenCV has no subpixel resolution by default (would need some additional coding, but the question is, is the subpixel resolution really worth it?)

For some reason I cannot use "All" setting for learning the template information in Labview. Can anyone confirm this please?

Also "Low Discrepancy Sampling" is a lot faster than "Pyramids" based matching in Labview... Possibly because of the nature of the image I used? Or maybe some additional tweaking is needed via the advanced options?

Anyway: If anyone finds out anything interesting, please post it here, since I am also curious (also using pattern matching techniques in my applications)!!!

The .dll was built with OpenCV 2.4.6 and VS2010. The Labview application requires at least Labview 2013, since the new pattern matching algorithms were introduced in 2013 version. There is also source code attached in case anyone takes this thing a bit further.

My test image and template is also attached.If you create your own template you can do it in any image editing program (Paint, etc...).

Best regards,

K

Klemen
8412 Views
15 Comments

Hello,

I am attaching a small program, which is usefull for detection of circularly shaped objects using the Hough transformation. The core of the code is taken from OpenCV and as usual built as a .dll that can be used in LabView.

The explanation of the parameters used for the detection can be found here:

http://docs.opencv.org/doc/tutorials/imgproc/imgtrans/hough_circle/hough_circle.html

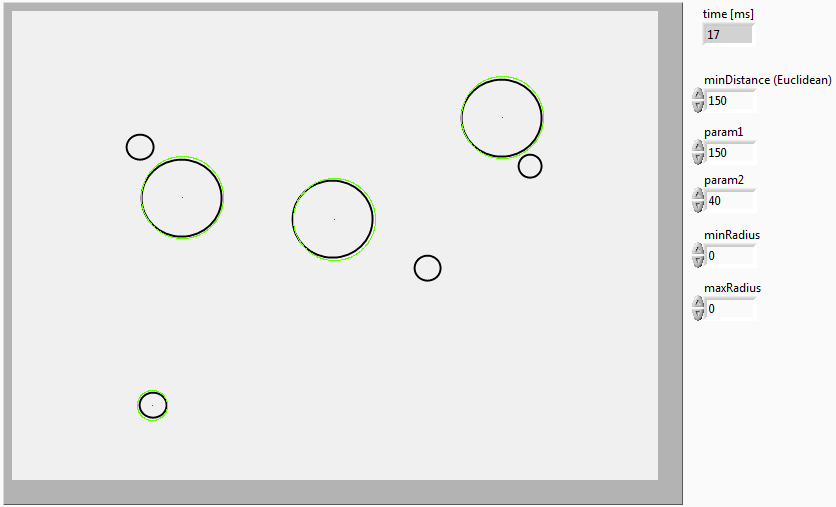
A neat parameter is the "minimum distance", which specifies the minimum distance between the two detected circle centers. This makes it possible to "filter out" the circles that are too tightly together. You can additionally also specify the minimum and maximum radius for the valid circle detection.

Figure 1 for example uses such parameters, that all the  circles are detected.


all_circles.png

Figure 1. All circles on the images are detected.

Changing the minimum distance, three small circles that are closer to the three bigger circles are excluded from the detection.

filtered_circles.png

Figure 2. Parameter minDistance is one of the parameters that influences the number of the detected circles.

The code I am attaching is the source code (c++), built .dll (release version) and a LabView example that uses the .dll.

The code was built using OpenCV 2.4.6 and the LabView version is 2010.

Hope someone finds this useful as a starting point in their project!

Best regards,

K

Klemen
5289 Views
1 Comment

Hello,

it is often of great value to compare the difference in depth of two objects after the 3D alignment of two point clouds. Obviously, this cannot be performed directly on the acquired depth images, since after the alignment (ICP for example) the indices from one depth image do not neccessarily correspond to the other depth image. Thus the depth calculation difference is erroneous.

This can be performed correctly using Z-buffering. I use a 3D viewer (developed at my company) that is able to obtain depth images from the specified viewpoint in the viewer. This makes it possible for me to correctly determine the deviation between two surfaces after the ICP alignment. Sadly, I cannot share the above mentioned viewer code, so I have prepared an alternative using the functionalities of the Point Cloud Library. The core of the code is basically taken from here:

http://pointclouds.org/documentation/tutorials/range_image_creation.php

and

http://pointclouds.org/documentation/tutorials/range_image_visualization.php

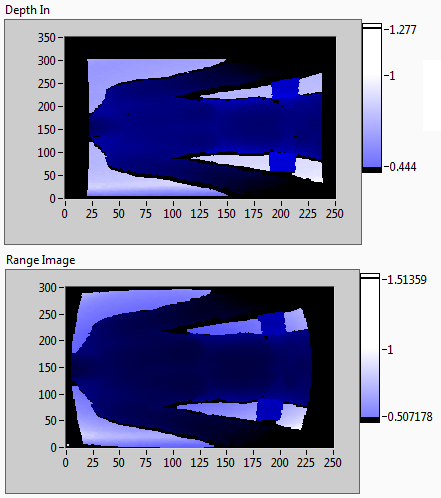
The screenshots below show the example. The code creates a pose of the virtual sensor using a specified coordinate system and creates a range image from a 3D point cloud(for more information, check the text in the first link above). I suggest using such setup that the axes of the measured object are aligned (as much as possible) to the axes of the coordinate system.


Figure 1. 3D of the measured surface.

depth.png

Figure 2. Depth image (Z-coordinate) from Figure 1 (top) and the range image taken form the 3D point cloud from Figure 1 (bottom).

Please don't ask why the depth scale is different for both cases and it really should not matter, when comparing two range images taken with the same setup parameters, since only the difference is relevant.

The code I am attaching is the source code (c++), built .dll (release version) and a LabView example that uses the .dll.

The code was built using PCL 1.6.0 and the LabView version is 2010.

Like always, please leave any comments below!

Hope this helps somebody.

Best regards,

K

Klemen
8315 Views
7 Comments

Dear readers,

there have been some questions on how to create a Visual Studio project from the source files (.cpp) that are attached to some of the posts on this blog. This makes it possible to modify the code to your preferences.

The post will hopefully act as a tutorial in order to successfully create a project using either OpenCV or PCL functionalities. You can setup the project manually of course, but I prefer using Cmake (open-source). This helps you configure all dependencies and libraries with a couple of mouse clicks. You can get it from here:

http://www.cmake.org/

After installing Cmake, follow the instructions below:

1. create a new folder (I will call it "project folder") and put the source code (.cpp) inside it. Create another folder inside the previously created folder and name it "build".


2. create a file named "CMakeLists.txt", put it in the "project folder" and setup the Cmake variables in the .txt as follows (replacing the bold text with your values):


     2a. using OpenCV


               cmake_minimum_required(VERSION 2.6)

               project(project name)

               find_package(OpenCV REQUIRED)

               add_executable(name source_file.cpp)

               target_link_libraries(name ${OpenCV_LIBS} )

     2b. using PCL


               cmake_minimum_required(VERSION 2.6 FATAL_ERROR)

               project(project name)

               find_package(PCL 1.3 REQUIRED)

               include_directories(${PCL_INCLUDE_DIRS})

               link_directories(${PCL_LIBRARY_DIRS})

               add_definitions(${PCL_DEFINITIONS})

               add_executable(name source_file.cpp)

               target_link_libraries (name ${PCL_LIBRARIES})

3. open Cmake and add path to source code (...\"project folder"). Add also the path to the "build" folder.

4. select "Configure" and specify the generator for the project (I use Visual Studio 2010). Use default native compilers. Click finish.

     4a. if OpenCV configuration is giving errors, complaining that OpenCV directory is not found, manually add it. Select "ungrouped entries" and specify the OpenCV dir "...\opencv\build". Click "Configure" again.

5. click on "Generate".

6. the "build" is now populated with the Cmake output. Open the Visual Studio solution.

7. in "Solution Explorer", right click on your project and select "Properties". Under "General" change "Target Extension" to .dll and change "Configuration Type" to "Dynamic Library (.dll)".

8. Apply changes and build solution. I suggest using "Release" configuration for optimized performance. Remember you need to do step 7 for the "Release" configuration also.

Hope this will be useful to people having troubles with building from source code.

Best regards,

K

Klemen
7455 Views
4 Comments

Hello reader(s),

I have tested the iris detection algorithm that is described in the paper titled:

"Automatic Adaptive Facial Feature Extraction Using CDF Analysis".

I have used OpenCV to track the face and consequently the eye(s) - the detection of the eyes is limited to the facial region. The source code and the .dll for face and eye tracking can be found in one of my previous posts titled:

"Real-time face and eye detection in LabView using OpenCV Harr feature classifier".

The only deviation from the above mentioned post is that here I used a different training set for eye detection, i.e. I used "haarcascade_righteye_2splits.xml" classifier file insted of "haarcascade_eye_tree_eyeglasses.xml". I am also attaching a .dll (but not the source) that reflects this change. SO, IF YOU WANT TO TRY THE CODE, YOU NEED TO FOLLOW THE INSTRUCTIONS IN THE ABOVE MENTIONED POST TO GET IT WORKING.

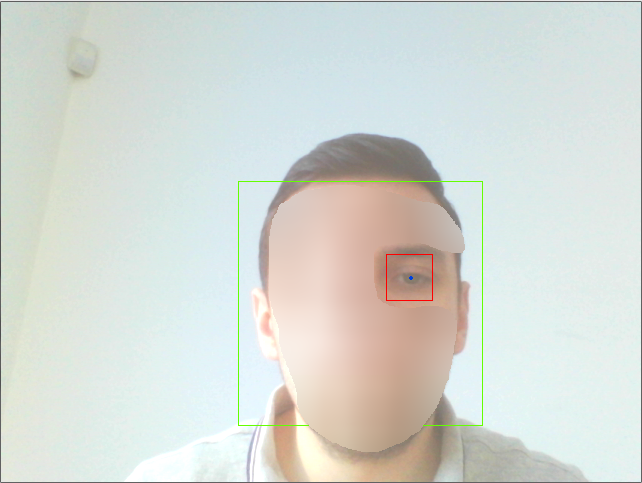
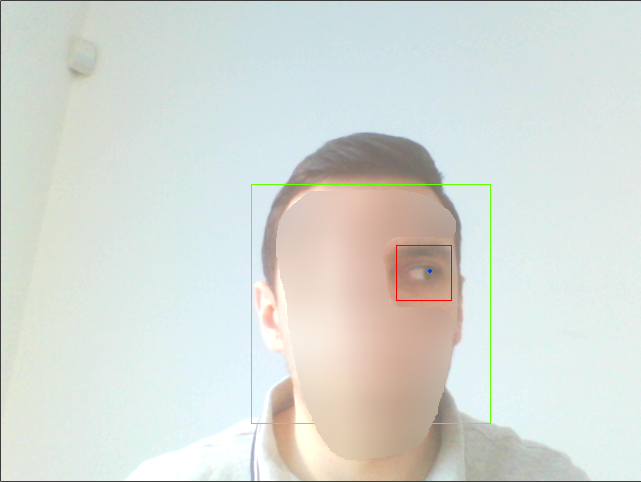
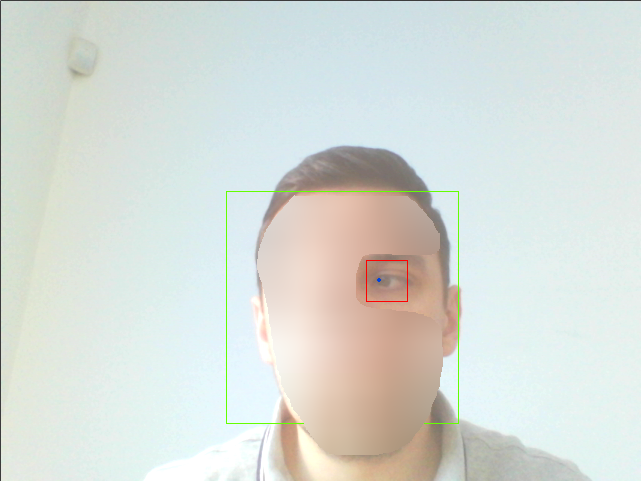
The results are quite good and the iris can be tracked in "real-time" (more than 10 fps with my laptop mid-performance computer, camera resolution 640x480 pix). Three screenshot images for different gaze direction are shown below:

iris_detection_pose1.png

Figure 1. Frontal gaze.

iris_detection_pose2.png

Figure 2. Left gaze.

iris_detection_pose3.png

Figure 3. Right gaze.

I am attaching the Labview code also, saved for version 2010. Please mind that the code is very, very dirty (my dirtiest code yet, I would say), so don't hold this against me. You should also take a look (and understand) the parameters for iris detection (read the paper) - mainly the CDF function and the morphological function (erode). These two parameters have the greatest impact on the detection.

I will try to clean up the code in the future (if I am not to lazy), but if someone manages this before me, which is likely (mostly the performance part) fell free to post it here and I will upload the code.

Hopefully somebody finds this useful as a starting point for their application/project.

Best regards,

K


P.S.: Feel free to comment...

Klemen
7699 Views
2 Comments

Hello,

turns out I have a little bit more time, so the next post is here!

I am just going to paste the intro to this post from the end of the previous post titled "Kinect in Labview using PCL - Point cloud library (C++ source code, dll, Labview example)":

"My next post will be talking about point cloud registration (also in Labview using PCL). I have used ICP (iterative closest point) algorithm in one of the previous posts to align two point clouds, but no coarse alignment/registration was made prior to the refined ICP registration. So in some cases, the alignment using only ICP is incorrect (mostly for greater degree of transformation - rotation and translation - between two successively acquired point clouds)."

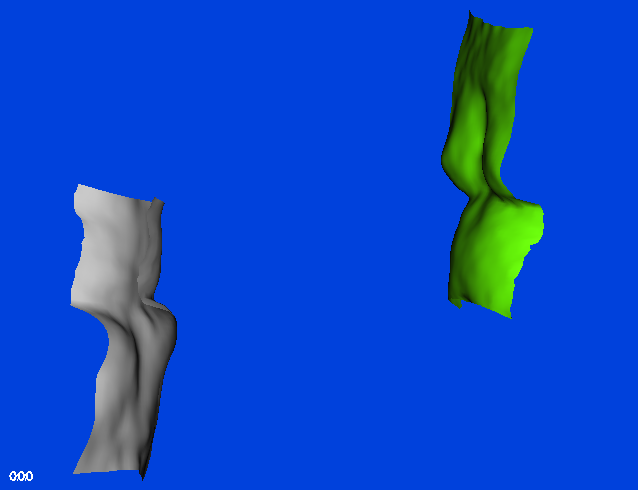
So for example, if you want to align the following point clouds (similar object/surface, but different position in space - so two acquired point clouds from different point of view) the ICP yields an incorrect result - in my case the algorithm does not converge:

source_target.png

Figure 1. Source point cloud/surface (gray) and the target point cloud/surface (green).

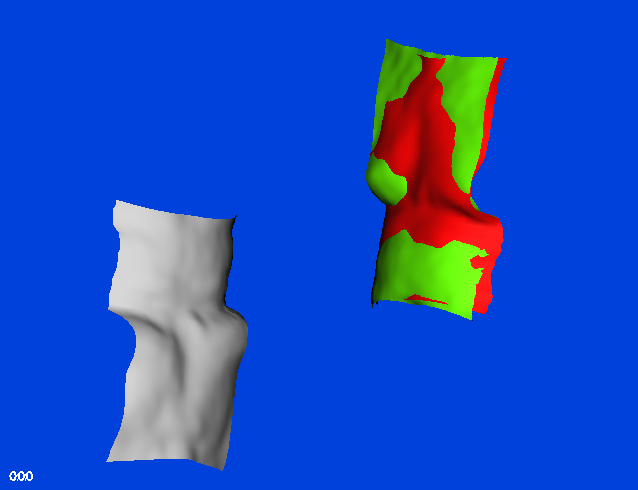
Using the feature based initial alignment (MORE INFORMATION ABOUT THE REGISTRATION AND ITS PARAMETERS etc... CAN BE OBTAINED FROM THE PCL web site, so I will not go into these details here) the result is:

source_target_sacia.png

Figure 2. Source point cloud/surface (gray), the target point ploud/surface (green) and the transformed source point cloud/surface (red) after initial alignment.

And after the initial alignment, the ICP algorithm produces the following result:

source_target_sacia+icp.png

Figure 3. Source point cloud/surface (gray), the target point ploud/surface (green) and the transformed source point cloud/surface (red) after initial alignment and ICP.

Also, the point clouds are filtered prior to registration using the MLS filter, that is not included (this is also a part of the PCL library and I use a seperate .dll for filtering). The Labview example is saved for Labview 2010.

I am attaching the source code, dll and a Labview example program. You need PCL 1.6.0 to be able to run/modify the example. The .dll was built using Visual Studio 2010x86.

Best regards,

K


Klemen
6944 Views
15 Comments

Hello,

I have not posted in a while so I guess I am a little bit rusty. For this reason, the following post will be really short. Actually the content is nothing new (check my first post), but I am attaching the source code, built dynamic link library (which can be called in Labview) and a Labview example.

The built .dll acquires (calibrated) 3D point cloud and corresponding RGB data (already aligned, so it can be directly overlaid over the 3D data) in VGA (640x480) format. You can modify the source code to get other resolutions (QVGA for example).

You need PCL 1.6.0 to be able to run/modify the example. The .dll was built using Visual Studio 2010x86.

My next post will be talking about point cloud registration (also in Labview using PCL). I have used ICP (iterative closest point) algorithm in one of the previous posts to align two point clouds, but no coarse alignment/registration was made prior to the refined ICP registration. So in some cases, the alignment using only ICP is incorrect (mostly for greater degree of transformation - rotation and translation - between two successively acquired point clouds).

Best regards,

K

P.S.: In order to see the depth image, you can wire the Z-coordinates to the "Intensity Graph" in Labview.

Klemen
4320 Views
0 Comments

Hello,

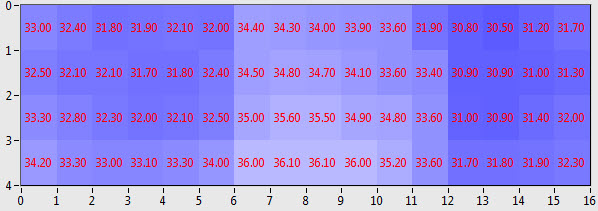
today's post will talk about real-time temperature measurements using the IR array sensor with 64 individual elements that measure temperature from Heimann Sensor's. The sensor has a horizontal resolution of 16 and vertical resolution 4 "pixels". The "pixels" are actually thermocouple elements that are spaced 220 microns apart. The sensor has different shutter times (e.g. refresh rates) from 0.5 Hz up to 512Hz - the higher the refresh rate, the higher the noise. The sensor is also pre-calibrated and the calibration data is stored on the internal EEPROM chip. This is then used for the calculation of actual temperature that each individual element "sees". The sensor also has another internal sensor to measure the temperature of the casing. Additional, the calculation equations also consider the temperature gradient across the casing, that has a direct impact on the accuracy of the measured temperature.

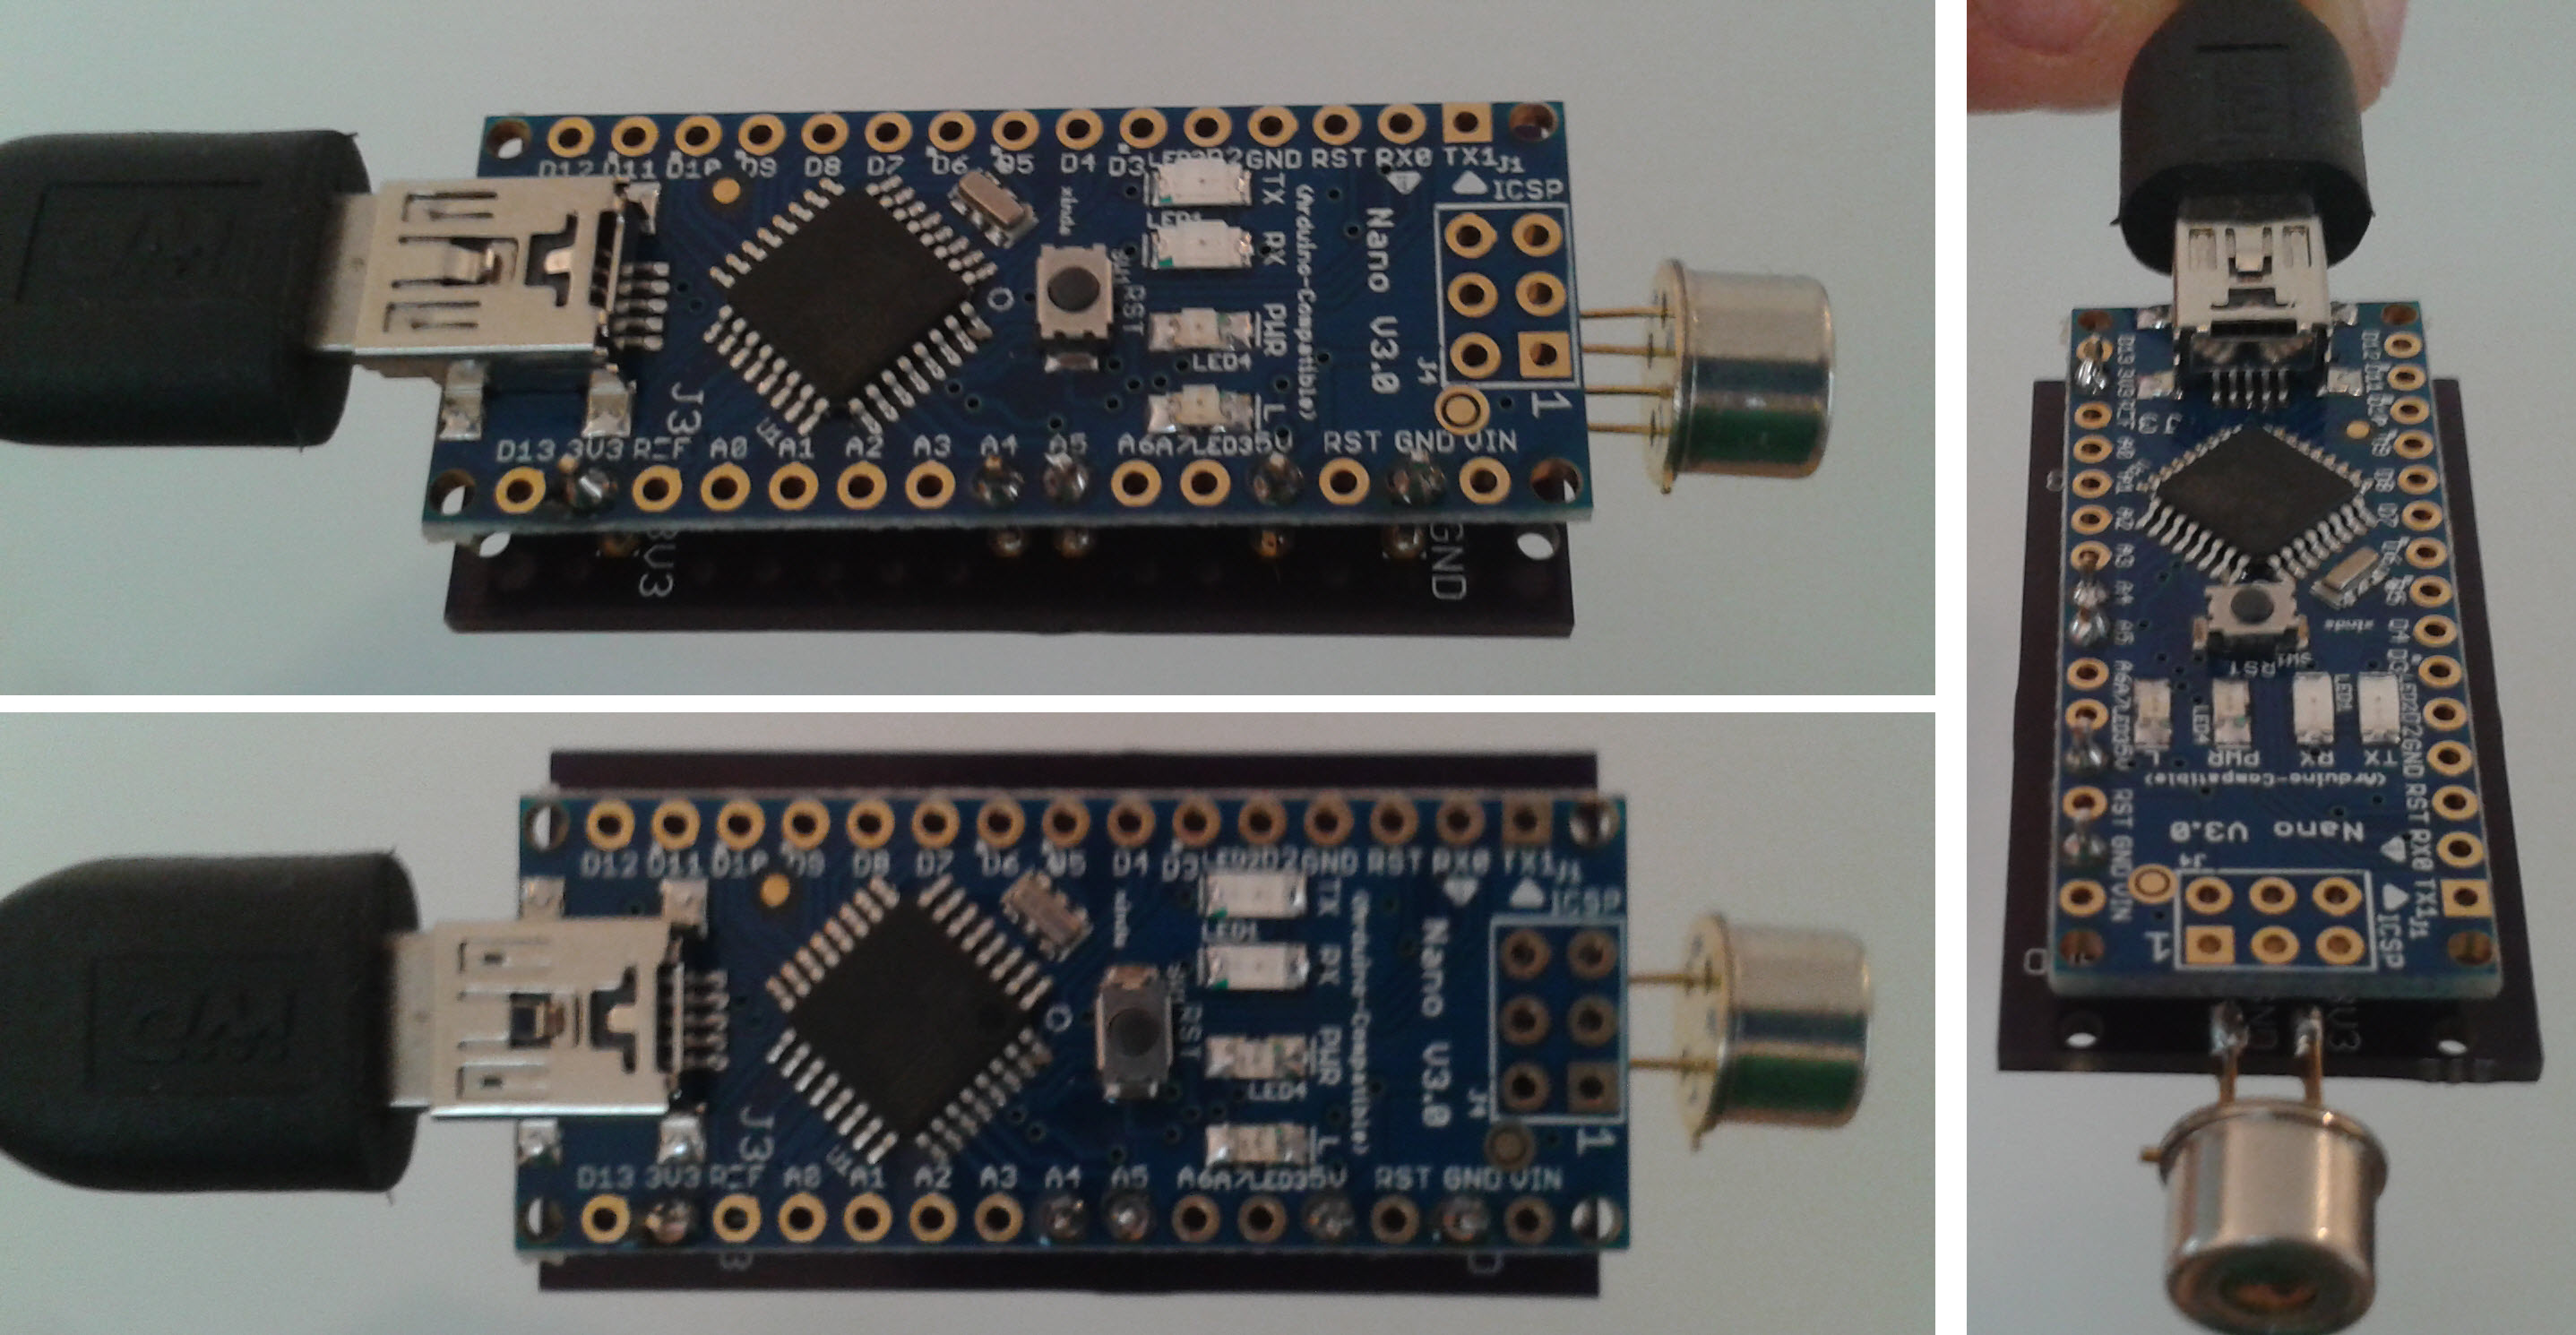
The communication protocol for the sensor is I2C, so I chose Arduino Nano, since its AVR supports the I2C feature and the board is relatively small (~43 mm x 18 mm). Additionally, I designed a simple custom board in Eagle that holds the sensor and other required electronic elements (resistors for I2C and a capacitor for power supply noise reduction) and can also be fitted and soldered on Arduino Nano (see Figure 1 below).

nano+htpa+board.jpg

Figure 1. Custom board with IR array sensor soldered to Arduino Nano (the holes at the corners will be used for securing both boards together, but for now the two boards are ony soldered together).

The code/algorithm on the AVR chip is written in C++ (using Visual Micro environment, with Arduino libraries) and the calculation of the temperature for all 64 "pixels". The algorithm also enables two way serial communication with the computer, sending the temperatures and receiving commands such as the refresh rate modification. All data sent over serial communication is subjected to DATA CHECK using the polynomial division algorithm. On the other side of the communication line, LabView program acquires (also data check) and interprets the data sent and then displays the temperatures (°C) in real time. Snapshot of the displayed temperature data is shown in Figure 2.

irArray.jpg

Figure 2. Intensity graph is used to display the temperatures of all 64 "pixels".

In the future I would like to insert both boards and the sensor in some kind of casing, so it would be more roboust and would also look a bit nicer . Also, eventhough the computers are really small nowadays (~10 inches) it would also be very cool to make the whole measuring system standalone (for example using SD card to save the temperature data or sending data over wireless). The negative side of this is that there is no immediate temperature display and it would be difficult to know if one is really measuring the desired area or something else altogether...

The microcontroller's and LabView's code is fairly optimized (as far as my programming knowledge is concerned), so I will be putting more effort in the physical design of the measuring system.

Be creative.

Best regards,

K

Klemen
25528 Views
63 Comments

(check out this link: https://decibel.ni.com/content/blogs/kl3m3n/2014/09/05/point-cloud-library-pcl-and-open-computer-vis...)

Hello,

I have been playing around with the face and eye detection algorithms in OpenCV and have again made a dll library, which can be called in Labview to perform face and eye tracking in real time (on my computer I achieve an average detection time of ~50 ms per loop, which equals ~20 fps using a webcamera with VGA resolution).

The algorithm first detects the faces in a live camera stream and then detects the eyes inside the "detected faces" regions of interest. The algorithm is based on Haar cascade classifier with OpenCV's default training samples.

I am attaching the dll and the source code along with the LabView sample code saved for LV2010. The dll was built using VS2010x86 and OpenCV 2.4.6.

I hope this helps someone in their project.

Be creative.

Best regards,

K

P.S.: Be careful to synchronize the path to the classifier files (can be seen in the source code). The LV algorithm tells you, if the classifiers are not loaded correctly.

P.P.S.: The .dll included detects only one face that corresponds to the biggest object in the scene. If you want multiple face detection, you need remove "CV_HAAR_FIND_BIGGEST_OBJECT" in the source code and rebuild the .dll. Or if you have any problems doing this, leave a comment and I will post the multi-face detection .dll.

Klemen
7696 Views
3 Comments

Hello,

in the past I have been trying to understand the Labview 3d picture control, but gave it up. To display a 3D point cloud, the Labview 3d picture control is in my opinion so complex and user unfriendly. Since Labview introduced the stereo vision library (in 2012 I think), I thought that they would also put some effort in 3D display of the acquired spatial data. This is not the case, since NI's stereo vision examples include only the display of the depth image and the 3D representation is left out. Eventhough the depth image carries the main "information" of 3D measurements (the distance from the measuring device - camera), it is often more practical to visulize the measured data in 3D space, maybe also with the texture if supported.

For this reason, I have built a dll, which enables simple viewing of the 3D data using the PCL visualization library.  The dll takes the inputs (X,Y,Z) and RGBA (where A stands for alpha channel) and displays the 3D point cloud as shown in the image below:

3d_pcl_viewer.png

The reason, the texture is gray is that I used the same values for all three channels (R, G and B). You can of course display point cloud with RGB texture. For now the viewer displays only points, but in the future I intend to upgrade the display, so that it can also show triangulated points (surfaces). This can also be achieved using PCL.

I am also attaching a dll and a Labview example program. The dll was built with PCL 1.6.0 and VS2010 x86.

Be creative.

Best regards,

K


Klemen
7261 Views
11 Comments

Hello,

Today I started working on porting the ICP algorithm from the PCL library (http://pointclouds.org/). This is such an excellent library for dealing with the point clouds and I have been using it to previously to acqure the data stream from the Kinect device.

I have created a dll which takes a reference 3D point cloud and another point cloud (same point cloud, but with some rigid transformation) which needs to be aligned to the first. I quickly tested the algorithm  and here are the results. A filter is also applied to the 3D point cloud to reduce the noisy surface (the surface was acquired using the Kinect). I also reduced the data so each point cloud uses only ~4000 points. The convergence time for 15 iterations is ~100 ms (10 Hz refresh rate).

Here are the results:

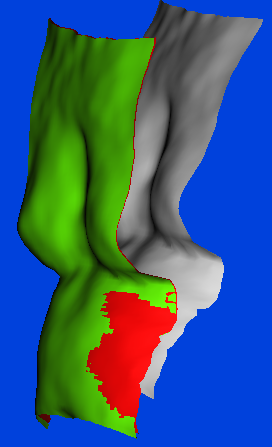
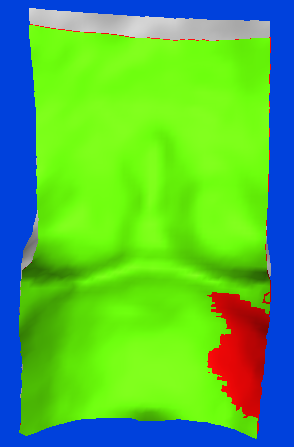
The gray 3D surface represents the input point cloud, which needs to be aligned with the reference point cloud (green 3D surface).

The red 3D surface represents the gray 3D surface after the ICP algorithm.

image1.pngimage2.png

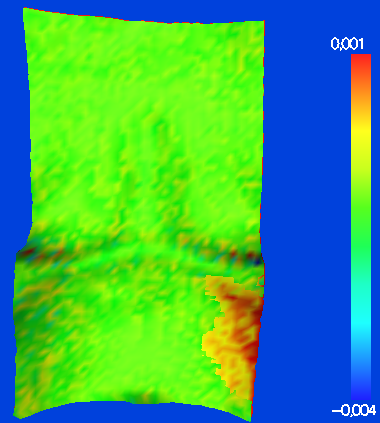
And the deviation between the reference and transformed 3D surface (the values are in meters):

image3.png

Be creative.

Best regards,

K

Edited on 30.9.2013:

I replaced the images of the ICP algorithm, after optimizing some of the parameters for my case. I have also used Moving least squares filter to reduce the noise and smooth the reconstructed surface. I used the transformation matrix, which consists of the rotation matrix and the translation vector. Applying this transforms the input pointcloud to the target pointcloud based on the ICP algorithm.

See:

https://decibel.ni.com/content/blogs/kl3m3n/2014/02/16/3d-point-cloud-registration-in-labview-using-...

for source/Labview code and example.

Klemen
4116 Views
0 Comments

Hello,

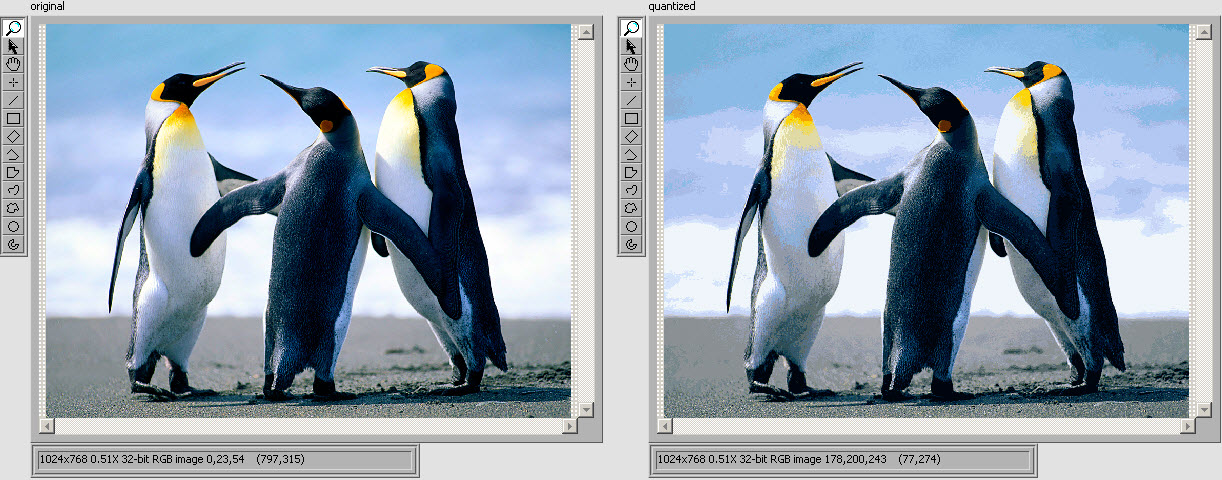
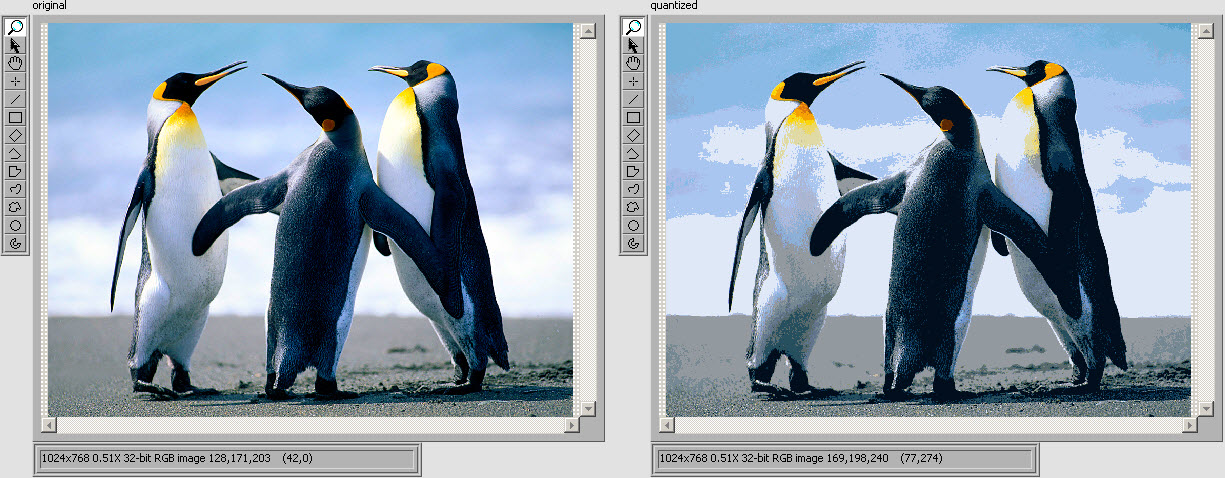
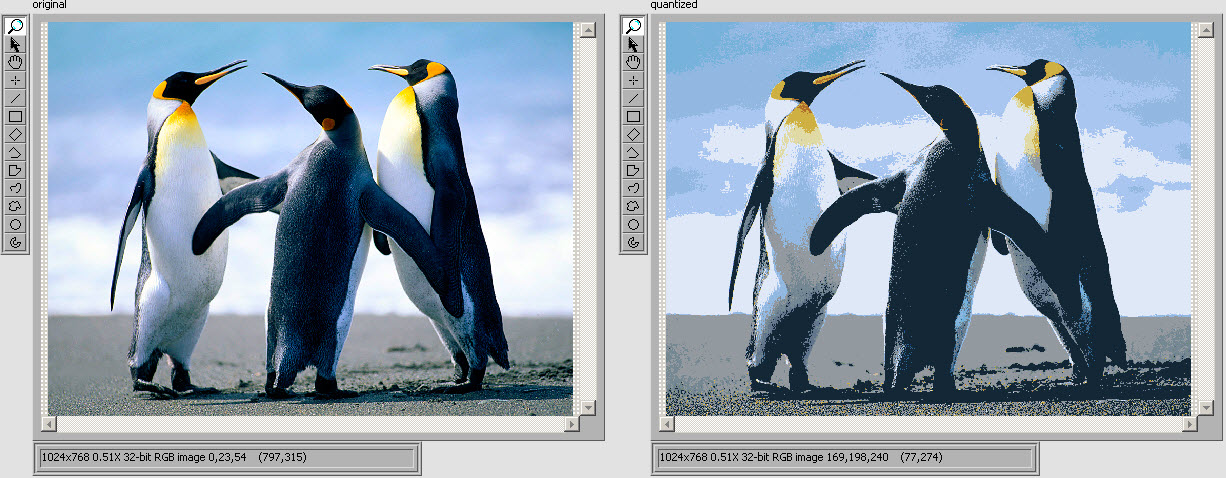
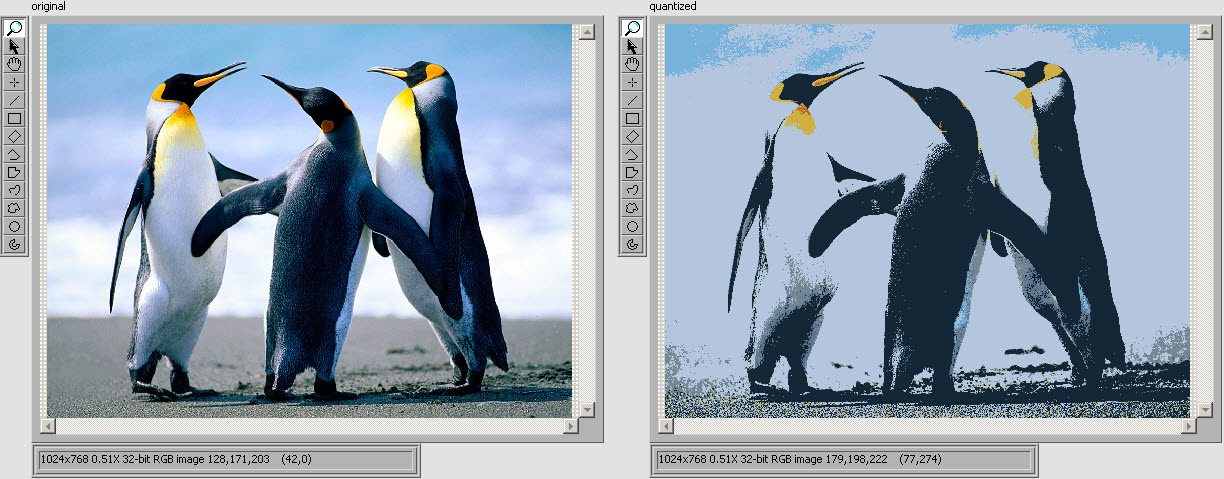
I am attaching a VI that performs Octree image quantization using the dotNET functionalities in LabView. This was made possible by (thanks 😞

1. Image quantization library found here: http://codebetter.com/brendantompkins/2007/06/14/gif-image-color-quantizer-now-with-safe-goodness/

2. bitmap handle to 2D picture convert VI found here: http://fabiantoepper.de/hbitmap-handle-mit-labview-lesen/

Currently, the only big problem with the attched code is that you must load the image from file. You can also use the image method to pass in the bitmap handle, but I do not have the knowledge to do this and am not planning to delve depper into this in the near future (the part, where the bitmap is passed as a bitmap handle). So please, if anyone makes any progress (with any part of the code) leave a comment here, since I am also interested in this.

In the experiments (the results are shown below) I am using .jpg images:

max_colors: 128

128.jpg

max_colors: 64

64.jpg

max_colors: 32

32.jpg

max_colors: 16

16.jpg

The attached VI is saved for LV2010. Please tell me if it does not work for you.

Best regards,

K

Klemen
7237 Views
5 Comments

Hello,

i have prepared and tested an implementation of HOG for human detection in LabView using OpenCV. The program is a good starting point to develop your own application for human detection. Don't forget, you can also train your own HOG descriptors for even more personalized application (please search online for more information, since there are some good examples of this). I plan to test the same code in Labview, but with GPU (nvidia) support (also OpencCV) and a live video stream, but i am currentlly having issues with my graphics card.

Here is the sample result of the image i got online (i hope i am not in violation of any copyrights 😞

hog_openCV_FP.jpg

I am also attaching the c++ source code, the dll and a LV2010 sample program. Code is compiled with VS2010 x86 and OpenCV 2.4.5. Add  "...\opencv\build\x86\vc10\bin" to system path or recompile the source code yourself.

Be creative.

Best regards,

K

Klemen
12792 Views
7 Comments

Hello,

yesterday I saw that the new VDM has a new library that is used to track objects based on mean-shift and extended mean-shift algorithm. Of course I had to try it out. Here are the results as a video, tracking the same object as in the last post with the SURF algorithm (the lag is due to my "expert" knowledge in screen video capture , it actually runs very smooth):

Video link to youtube: http://www.youtube.com/watch?v=8V9KwGpQ_14


I am also attaching a simple piece of code, where you can select the bounding box of the object and track it in real-time (without the quotation marks as was in the previous post ).

Be creative.

Best regards,

K

Klemen
10682 Views
1 Comment

Hello,

I have invested some time trying to track features in "real-time" using the SURF (Speeded up robust features) keypoints and descriptors. I wrote real-time with quotation marks, because the speed is roughly 8 fps at 640x480 resolution (in my opinion real-time is 20+ fps).

The code is based on openCV libraries and called as a .dll in labview. It takes an object image and detects the best match keypoints (using  distance criteria)  on the live stream image from a webcamera. Using these keypoints, homography is then calculated using ransac algorithm (mapping the points from the object image to the webcamera image). Then, taking the corner points of the object, the corresponding positions on the live image are calculated and overlaid along with the keypoints and the connecting lines.

Below is the video and here is the link to youtube: http://www.youtube.com/watch?v=D13-Px548yM

Be creative.

Best regards,

K

Klemen
6721 Views
2 Comments

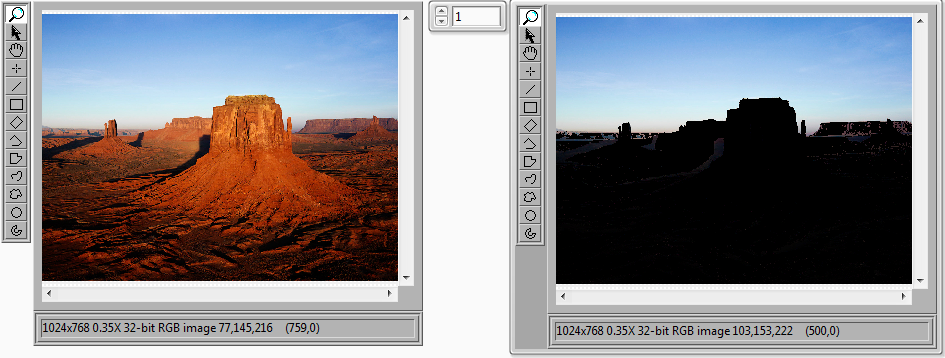
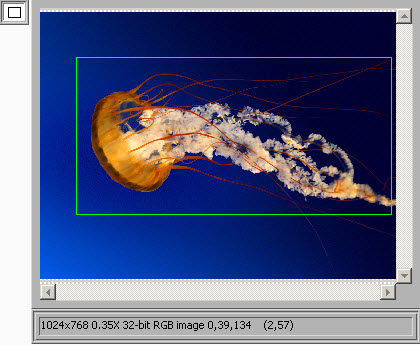
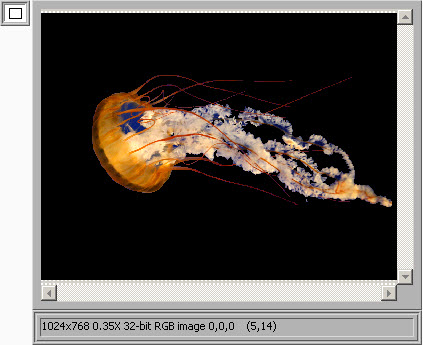
Yet again I will post two algorithms based on openCV and built as a DLL library (along with c++ source code and labview vi), that are useful (at least I found them useful in my projects), but  not included in the NI Vision libraries:

- color histogram matching and

- grabcut segmentation.

I really like labview for its simplicity and some really good vision functions/libraries. I also love openCV because it includes so many good up to date computer vision algorithms. In my opinion, the combination between labview vision and openCV is an excellent and formidable beast, that can accomplish almost anything.

I hope that someone finds this (and similar) posts useful for their projects. Beats starting from scratch anyways. Code is compiled with VS2010 x86 and OpenCV 2.4.5. Add  "...\opencv\build\x86\vc10\bin" to system path or recompile the source code yourself.

Examples of segmentation:

original1.jpgsegmented1.jpg

original2.jpgsegmented2.jpg

original3.jpgsegmented3.jpg

Example of histogram comparison:

original.jpg

                                   ORIGINAL IMAGE

original_light.jpgoriginal_dark.jpg

                              LIGHTER IMAGE                                                                                     DARKER IMAGE

Comparison results:

original image VS original image -> correlation = 1

original image VS lighter image -> correlation = 0.139762

original image VS darker image -> correlation = 0.192917

Be creative.

Best regards,

K


Download All