- Subscribe to RSS Feed
- Mark Topic as New
- Mark Topic as Read
- Float this Topic for Current User
- Bookmark
- Subscribe
- Mute
- Printer Friendly Page
Model railroading
04-26-2005 07:27 AM
- Mark as New
- Bookmark
- Subscribe
- Mute
- Subscribe to RSS Feed
- Permalink
- Report to a Moderator
You know after working so hard to get data into the graph, it just did not occur to me to write nothing to it!
Next time I will try that. THe good news is i learned something in the process of setting the 3-d graph properties programatically.
1) The Z-axis is item #3 just like you would expect.
2) You have to set the cursor visable after you add it.
Like I said real stuff tonight!
Ben
04-26-2005 07:35 PM - edited 04-26-2005 07:35 PM
- Mark as New
- Bookmark
- Subscribe
- Mute
- Subscribe to RSS Feed
- Permalink
- Report to a Moderator
This is how it went.
STEP ONE Get image.
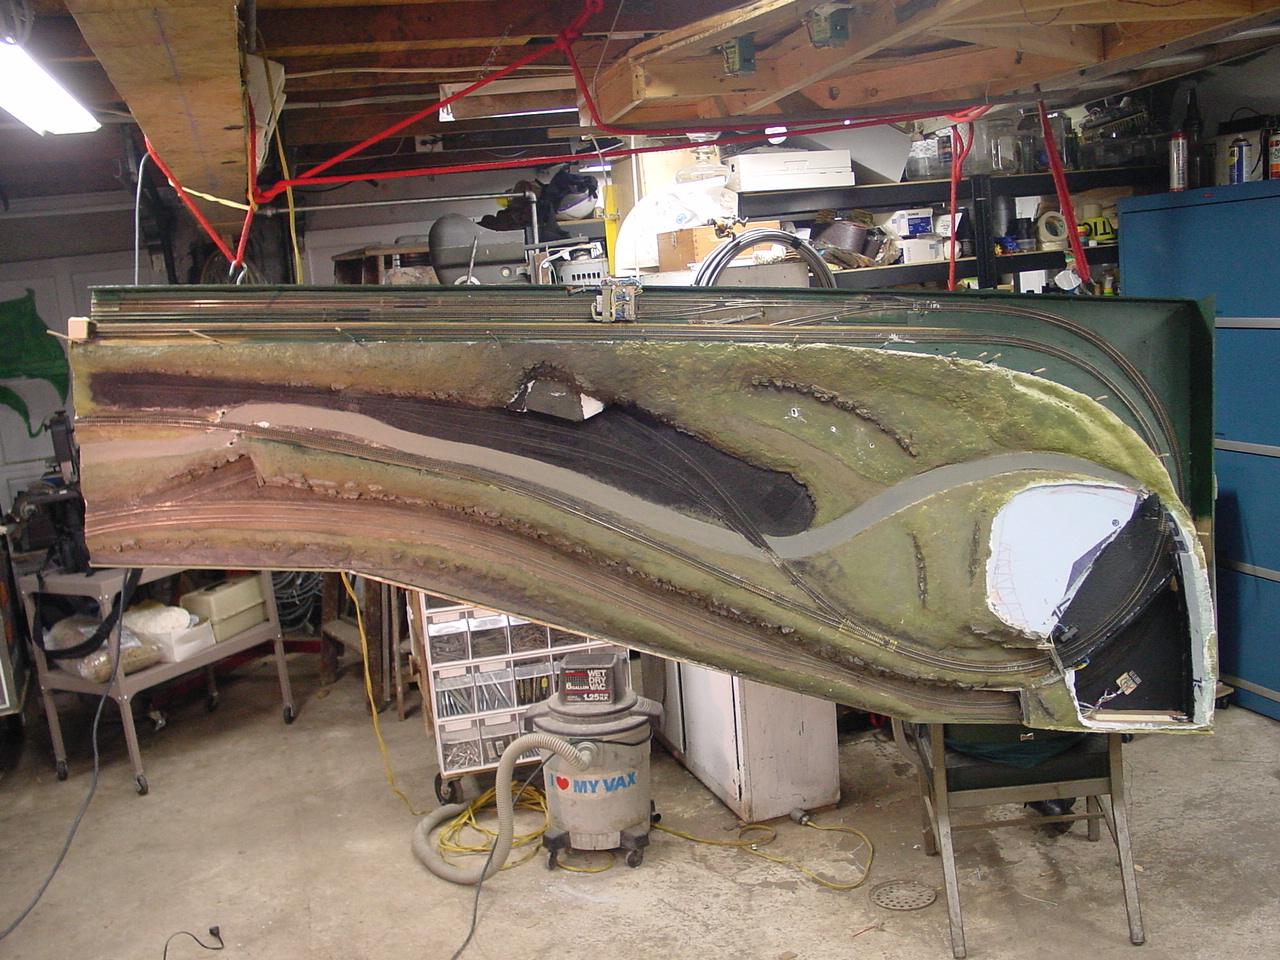
First I found a jpg of part of the layout when it was hanging in my lab. See "HangingLayout1.JPG".
That image was edited to get just the layout as shown in "HangingLayout9.JPG".
I used this image to define the color mapping of the points in a parametric plot.
This image was just to large for my machine to handle so I used Paint to shrink it down into what is shown in "HangingLayout11.JPG".
My machine was able to plot this image on a flat plane that I defined just based on the pixel location and a constant z.
STEP TWO Get colors from picture.
I was disappointed to find that the color map ended up just washing out to a grayscale.
After investigating and thinking about it, I convinced myself this made sense. It tuns out there were about 30K colors in the image and the indicator was not much larger than the picture so I mostly had multiple colors getting mapped to the same pixel.
To get around this I just took a subset of all of the colors. This part of the code could stand alot of improvement. I think there is also a possible bug if the last color gets duplicated due to a poor allighnment of the stars.
STEP THREE define elevation.
The next issue was defining the z-axis. in earlier experiments I had conducted, I decided that the first three dirivitives of an image are not very helpful when trying to define elevation. I did not try that here. I did not want to have to define a z value for each location due to the large pixel count. As an alternative I specify an evenly spaced set of of points that are in turn to spline fit all of the other points. This worked enough to keep me interested because i only had to specify 1 in 10 points.
ENCLOSED EXAMPLE
When you look at the FP before you run it you will see a blank graph and bunch of distordely controls and indicators. Below the 3-d graph is a 2-d array of floats that defines the z-values that worked good for me.
There is also a file path that MUST be set to the proper location to find the file "HangingLayout16.JPG".
Once you run the example the map should be displayed in 3-d as specified by the 2-d array of floats.
As the cursor is moved about the layout, the array that specifies the z values is updated such that you are always selecting the point that dictates the z value at that point PROVIDED, the cursor is at a even multiple of 10. Other times it is close. Another area that could stand some improvement. Ultimately I would like to find a better way of moving about the map but that is what I have for now.
GENERAL COMMENTS
As you are looking at this example remember that a prametric plot does not have to lie in a rectangular matrix like I used for the picture.
If you add about 20 or more contours (by changing the style of the plot) that are based on the z-values, you will see some of the odd edges affect that result from my spline fits. The back side had very little work so I ask that you "pay no attention to the man behind the curtain".
The attached sample is offered as learning fodder for those that are interested. It is also not a good example of LV style! It just a lot of experiments.
I just ask that if you find a better or novel way of using this example, please post your improvement.
There are alot of things I still need to learn about using the 3-d chart and I hope that we could turn this into something more useful than a way to look at my layout without having to visit my neighbor.
Thanks for reading!
Ben
Message Edited by Ben on 04-26-2005 07:36 PM
- Tags:
- LabVIEW_3D
04-27-2005 12:25 AM
- Mark as New
- Bookmark
- Subscribe
- Mute
- Subscribe to RSS Feed
- Permalink
- Report to a Moderator
This exactly what I tried to do a few months ago. Uncessfully because I had to work with an unevenly paced triangular mesh (about 30000 points, up to the max limit). So far, I have not found a proper way to convert this mesh to square, and I'm stuck...
You did a superb work here !
CC
04-27-2005 06:46 AM
- Mark as New
- Bookmark
- Subscribe
- Mute
- Subscribe to RSS Feed
- Permalink
- Report to a Moderator
Does this help you at all?
The data values get presented as a 2-d array (I believe) just to help CW figure out which set of points should be used to contruct the individual planes.
Remeber the 3-d pipe demo I posted a while back. The data is presented as 2-d array but the actual sets of values can be arbitrary.
Ben
06-13-2005 10:13 AM
- Mark as New
- Bookmark
- Subscribe
- Mute
- Subscribe to RSS Feed
- Permalink
- Report to a Moderator
If your a train enthusiast then you will love this place, the whole town was developed around the railroad, the setting is perfect. You have to go.
Joe.
"NOTHING IS EVER EASY"

08-04-2005 08:27 AM
- Mark as New
- Bookmark
- Subscribe
- Mute
- Subscribe to RSS Feed
- Permalink
- Report to a Moderator
Here is some interesting dcc software. Not sure if this could be absorbed into labview somehow.
05-11-2006 08:57 AM
- Mark as New
- Bookmark
- Subscribe
- Mute
- Subscribe to RSS Feed
- Permalink
- Report to a Moderator
Hi All,
Since the Exchange has now been enhanced to allow the inclusion of images in posts (and because one of my customers was asking...) I am updating this thread to show the images I posted earlier.
See above posting for a discusion of the images as originally posted.
Ben
Right half of layout hanging in work shop
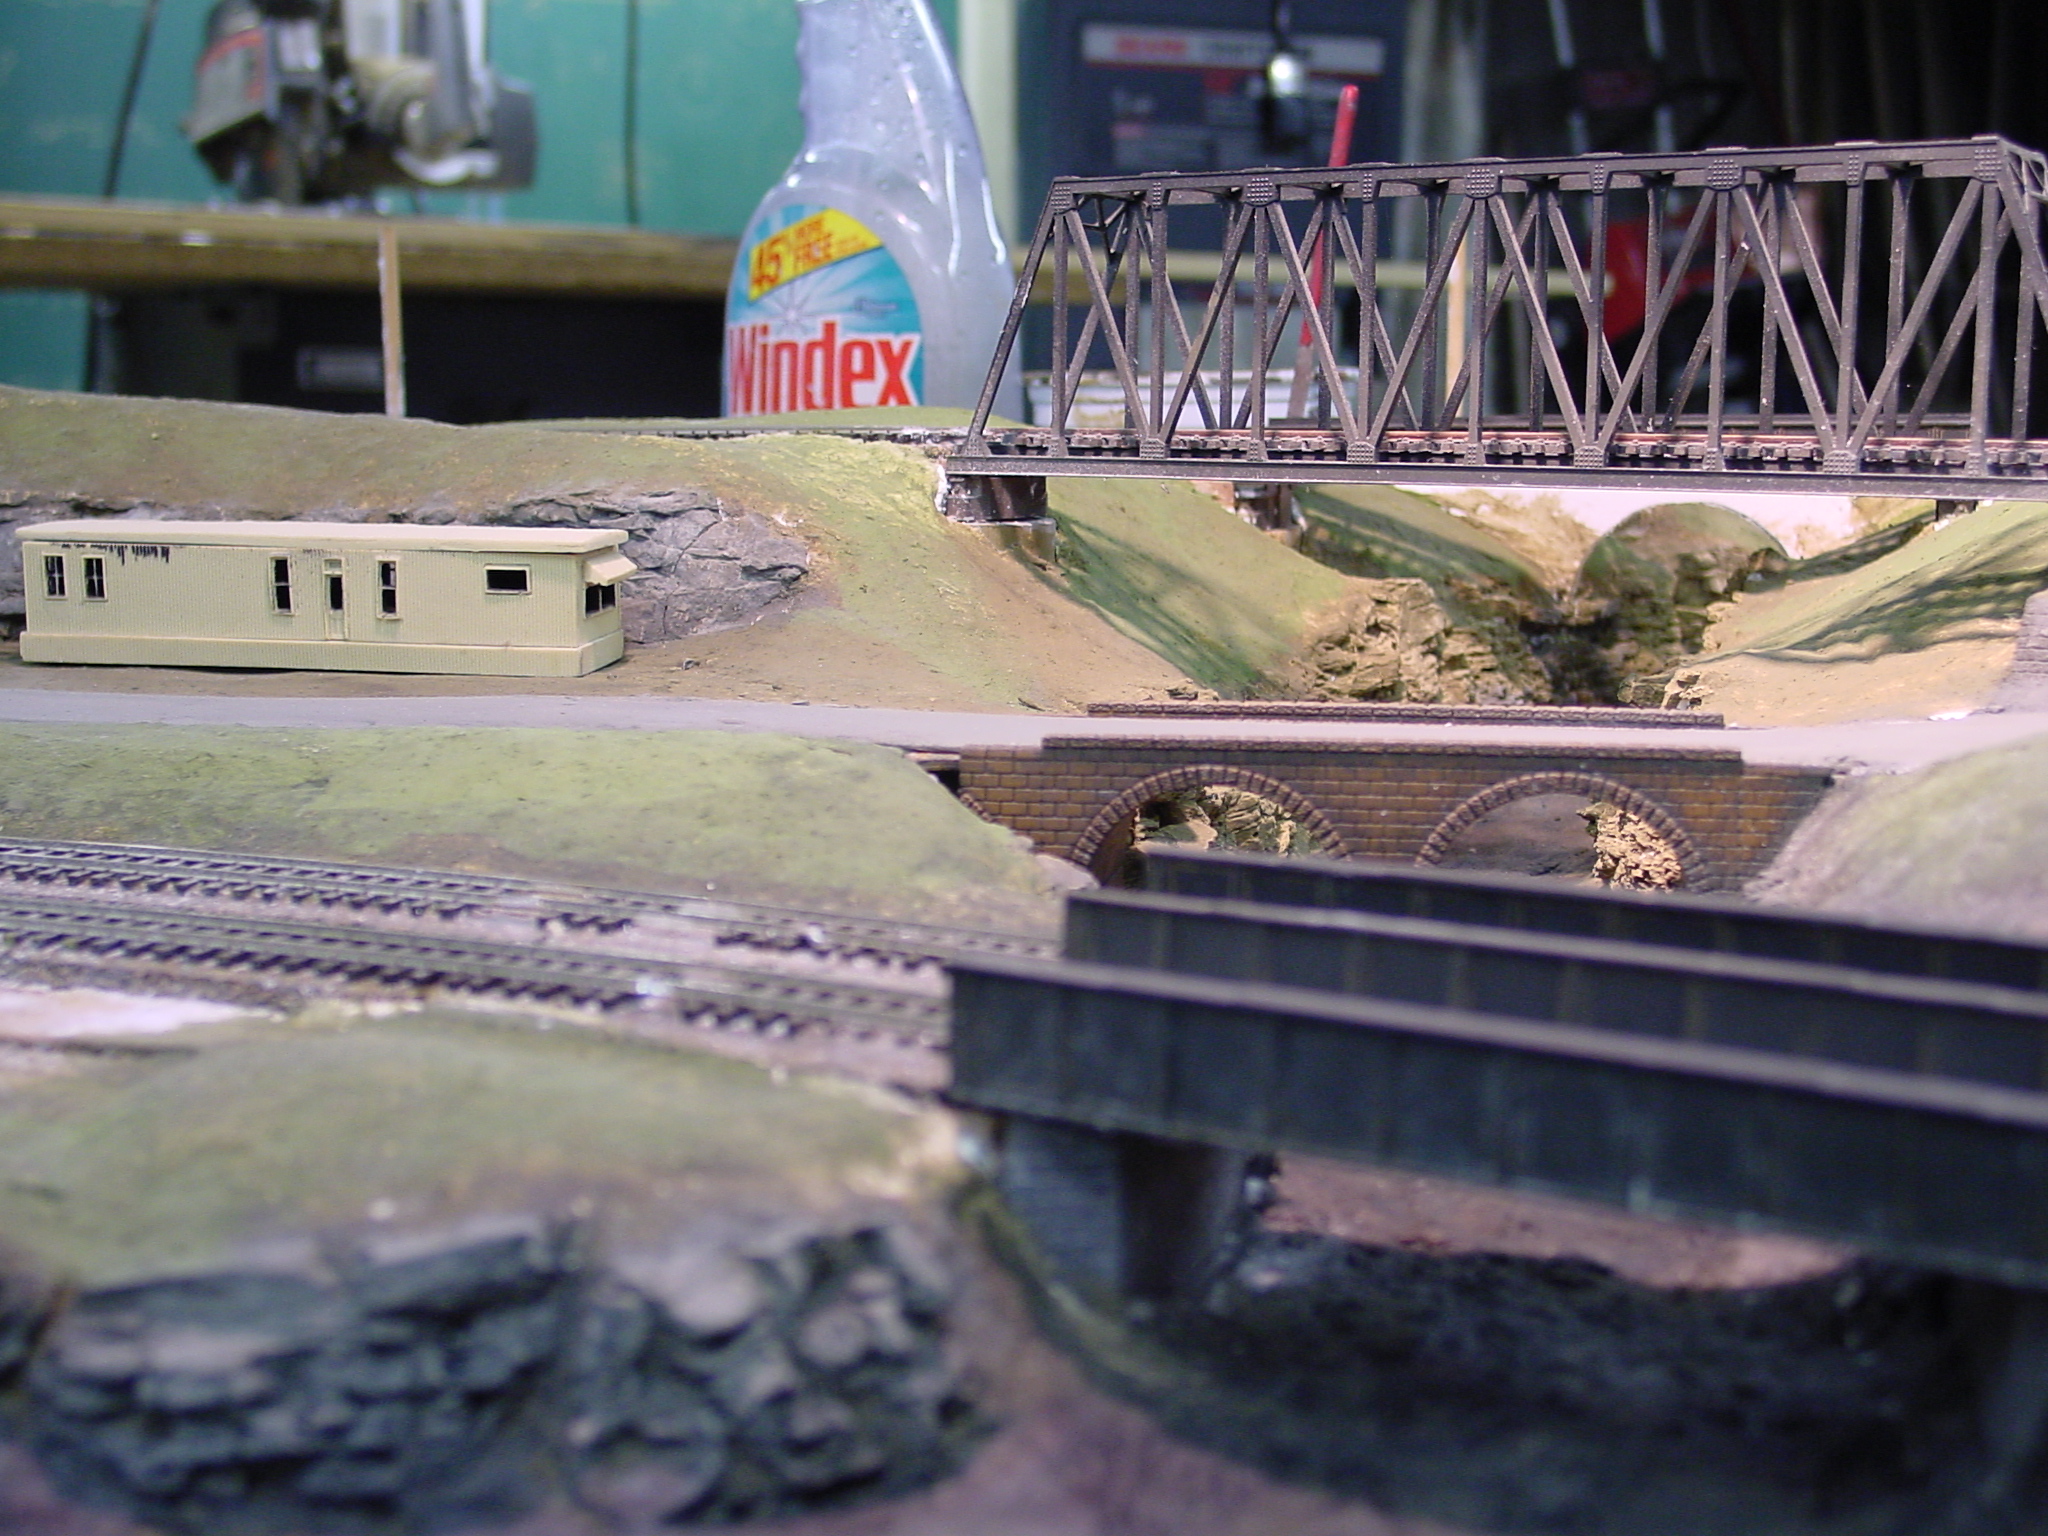
The town of "BridgeVIEW"
Wide angle shot of layout. Please note LabVIEW application running on laptop

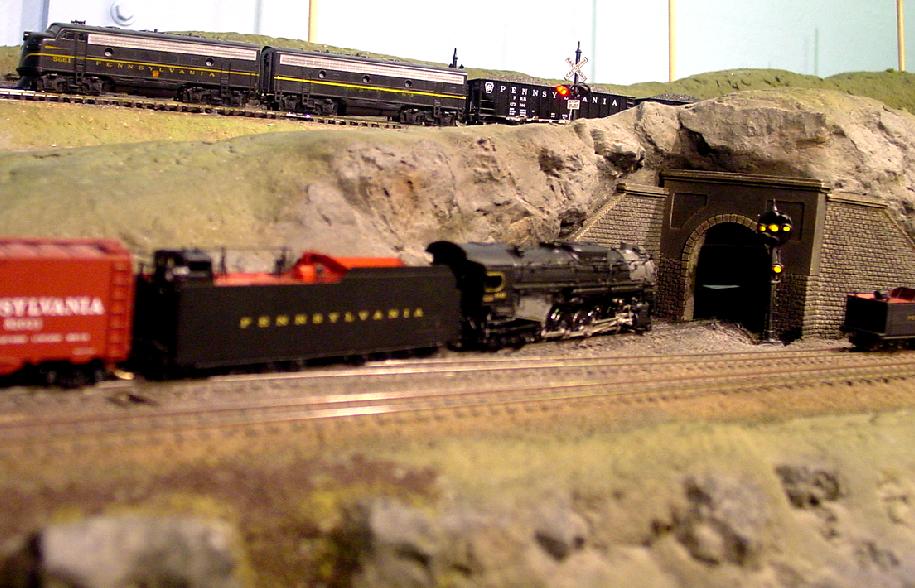
Picture of of operation crossing gate
10-30-2007 11:46 AM - edited 10-30-2007 11:46 AM
- Mark as New
- Bookmark
- Subscribe
- Mute
- Subscribe to RSS Feed
- Permalink
- Report to a Moderator
I just realized I nver posted an image of what the layout looks like in 3d.
Here it is.

Ben
Message Edited by Ben on 10-30-2007 11:47 AM
10-30-2007 01:27 PM
- Mark as New
- Bookmark
- Subscribe
- Mute
- Subscribe to RSS Feed
- Permalink
- Report to a Moderator
Ben:
What that 3D view done in VRML? (Virtual Railroad Model Layout)![]()
Nice setup!
-AK2DM
"It’s the questions that drive us.”
~~~~~~~~~~~~~~~~~~~~~~~~~~
10-30-2007 01:48 PM
- Mark as New
- Bookmark
- Subscribe
- Mute
- Subscribe to RSS Feed
- Permalink
- Report to a Moderator
![]()
No it was done in LabVIEW.
See reply #32 and the code is attached in the zip labeled "As70.zip"
I always wanted to go back and revise that example for LV 8.X to take advantage of teh cubic-hermite spline fit but never got around to it.
Ben
