- Subscribe to RSS Feed
- Mark Topic as New
- Mark Topic as Read
- Float this Topic for Current User
- Bookmark
- Subscribe
- Mute
- Printer Friendly Page
Elegant Variables vs. Time Graph
Solved!10-25-2010 12:33 PM
- Mark as New
- Bookmark
- Subscribe
- Mute
- Subscribe to RSS Feed
- Permalink
- Report to a Moderator
Just to prove how much of an absolute gumby I am, I shall post this extremely basic question.
See attached VI. This is a variable vs. time graph. Delta t varies, so I cannot use a single value for time delta. I am guessing there is a simpler, more elegant way to accomplish what I am doing. If you know of one, your help would be much appreciated.
Thanks!
Lapsed CLAD, LV 5 - LV 2023 (Yeah, I'm that old...)
Solved! Go to Solution.
10-25-2010 12:37 PM
- Mark as New
- Bookmark
- Subscribe
- Mute
- Subscribe to RSS Feed
- Permalink
- Report to a Moderator
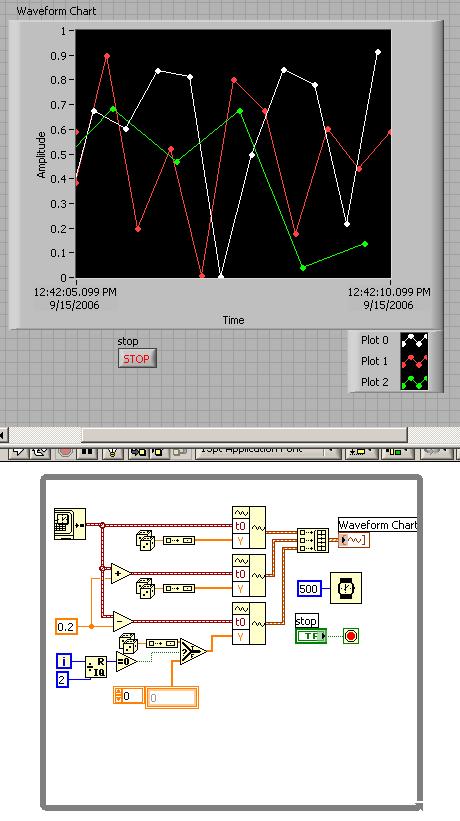
The image above shows how to use a chart but the ideas are the same for graphs.
That image came from this thread.
Ben
10-25-2010 01:28 PM
- Mark as New
- Bookmark
- Subscribe
- Mute
- Subscribe to RSS Feed
- Permalink
- Report to a Moderator
Thanks, Ben! I've tried to do what you suggest, and the Y values look good, but the X values are funky, or at least the axis labels are funky. It appears as though it is charting all the data, but the minimum value on the X axis keeps updating to the current time, whereas the maximum value keeps increasing far more rapidly than the actual time. Note that I clicked the "Autoscale X" values in the property fields for this chart.
- Forbes
Lapsed CLAD, LV 5 - LV 2023 (Yeah, I'm that old...)
10-25-2010 02:04 PM
- Mark as New
- Bookmark
- Subscribe
- Mute
- Subscribe to RSS Feed
- Permalink
- Report to a Moderator
Ah! Made it a graph instead of a chart, and all is well. Is there any way to simplify the attached vi further?
Thanks again, Ben.
Lapsed CLAD, LV 5 - LV 2023 (Yeah, I'm that old...)
10-25-2010 02:09 PM
- Mark as New
- Bookmark
- Subscribe
- Mute
- Subscribe to RSS Feed
- Permalink
- Report to a Moderator
My public machine does not have a modern version of LV* so if you want me to look, please post an image.
Ben
*I maintain a virtual firewall to my development PCs. I never use a web browser on them nor do they get MS software loaded.
10-25-2010 02:25 PM
- Mark as New
- Bookmark
- Subscribe
- Mute
- Subscribe to RSS Feed
- Permalink
- Report to a Moderator
Image attached. Thanks again for your help.
Lapsed CLAD, LV 5 - LV 2023 (Yeah, I'm that old...)
10-25-2010 02:38 PM
- Mark as New
- Bookmark
- Subscribe
- Mute
- Subscribe to RSS Feed
- Permalink
- Report to a Moderator
You have an ever growing dT number because the current time - initial time is always increasing. So after 1 second, you have 1 sample with a dT of 1. After 2 seconds, 2 samples dT=2 (4 seconds total time). After 3, 3 samples dT=3, 9 seconds total time.
So the timeline of your graph is not just growing in time, but actually stretching because of the continual increase in the delta Time.
10-25-2010 02:39 PM
- Mark as New
- Bookmark
- Subscribe
- Mute
- Subscribe to RSS Feed
- Permalink
- Report to a Moderator

Only a simple suggestion presents itself. The WF data type functions are fancy clusters and since teh "T0" and "dt" are the same you can bundle them once, and then use just the "Y" on your other nodes.
I hope that helps,
Ben
10-25-2010 02:53 PM
- Mark as New
- Bookmark
- Subscribe
- Mute
- Subscribe to RSS Feed
- Permalink
- Report to a Moderator
Ben,
Unfortunately, I do not understand what you just wrote or how to impliment it. Any clarification would be greatly appreciated.
Thanks.
Lapsed CLAD, LV 5 - LV 2023 (Yeah, I'm that old...)
10-25-2010 03:05 PM
- Mark as New
- Bookmark
- Subscribe
- Mute
- Subscribe to RSS Feed
- Permalink
- Report to a Moderator
You may not have understood it becuase what I wrote is wrong. I missed that the "T0" is different for each so my suggestion would only apply yo the "dt".
You can re-size those WF functions and select which part you are replace in the WF data type wire. SInce the "dt" are the same you can bundle those once then run the wire (that now has your "dt" value in it) to the two nodes you show (The top left of the WF build node accepts an input) but they will only have "T0" and "Y". like i said, trivial.
Ben
