ni.com is currently undergoing scheduled maintenance.
Some services may be unavailable at this time. Please contact us for help or try again later.
- Subscribe to RSS Feed
- Mark Topic as New
- Mark Topic as Read
- Float this Topic for Current User
- Bookmark
- Subscribe
- Mute
- Printer Friendly Page
Dr. Damien's Development - Benchmarking LabVIEW Code
07-13-2010 07:31 AM - edited 07-13-2010 07:32 AM
- Mark as New
- Bookmark
- Subscribe
- Mute
- Subscribe to RSS Feed
- Permalink
- Report to a Moderator
Many of my previous posts have involved optimization of one type or another. They often include benchmark numbers. What is the best way to do it? This post will present several methods of general use on desktop operating systems.
The biggest problem with benchmarking desktop operating systems is the large number of background processes and the the many optimizations done by the system itself. Before starting a benchmark, you should shut down all extraneous processes or things which may cause random time issues. Some things to consider:
- Screensaver — disable
- Antivirus — disable
- All applications — close
- Hard drive indexing — disable
- Network connections — disconnect and/or disable the hardware
In addition, make sure all your drivers are up to date (video, audio, chipset, &c). Now you can start setting up your LabVIEW environment and your VIs. Take the following steps:
- Turn off auto error handling and debugging on VIs (in VI properties execution page).
- Save and close everything, including any project.
- Open the VI which contains your benchmark, but do not open its block diagram.
Now run your benchmark several times, taking the shortest time. Even with all the care you have taken, a multi–tasking desktop operating system will interrupt your process occasionally. Multiple runs give you a reasonable chance of having fewer interruptions. If the execution time is under the application slice time for the operating system (the time increment that preemptive multitasking is divided into), you should not need to try many times. Default slice time for a desktop operating system tends to be in the 5ms to 15ms range.
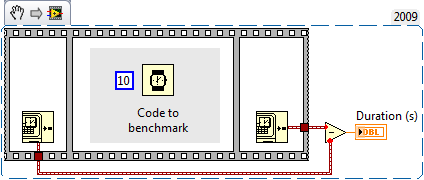
How do you write code to actually benchmark something? The classic way is to use a three–frame flat sequence and put timestamp generators in first and last frames with the code to be benchmarked in the center. Common methods use the millisecond timer, time/date in seconds, or calls to the Windows high performance counter. The time/date in seconds version is shown below. Note that this method has microsecond resolution on OS X and Linux, since both use the high performance timer under the hood. Windows, unfortunately, requires calls into system DLLs to get the same performance (see attached code for examples). Time/date in seconds has millisecond resolution on Windows.
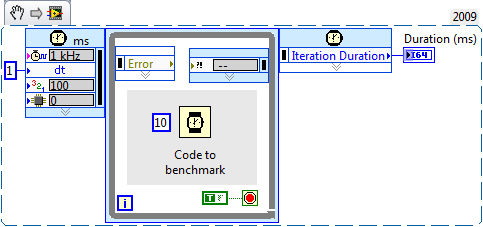
An alternate method for timing is to use the timed loop. In using the timed loop, the output is in clock ticks. The clock source is set on the input. Real time and FPGA systems have far more options than desktop systems. I saw this method recently on these forums, but was unable to find it again. My thanks to whoever posted it, and apologies for not properly attributing it. Note that on Windows, the input timing source will limit you to millisecond resolution.
A final potential method is to use probes connected with a functional global. Included in the attached code is an example of this using the time/date in seconds primitive. It works on a double data type wire. Put the probe and its subVI into your probe directory. Place two probes, one before and one after the code to time. Ignore the first. Look at the output of the second. I have not worked with this method much, and there are many places it could fail. It is also not multi–threaded. If you try it, do not use it in two places at once.
I would be remiss in not mentioning the LabVIEW profiler. It can be used to determine what parts of an application are taking the most time or memory. Details of operation can be found in the LabVIEW help, so I will not repeat them here.
If you would like to measure something that has a very short duration and you cannot use high resolution timers, you can wrap your functionality in a FOR loop and divide the end time by the number of iterations. Be careful in doing this that you do not run into constant folding, which can seriously change your result. If the LabVIEW compiler can figure out a result at compile time, it will precalculate it and insert a constant into your code in place of the actual code. For example, a constant value of 2 wired to the square root primitive will be replaced by a constant which is the square root of two. You can avoid this type of issue by using the random number generator instead of a constant. Do not forget to also benchmark generating random numbers so you can figure out how long your infrastructure (loops, random number generator, &c.) is taking to execute.
As usual, questions and comments are encouraged. Attached code is in LabVIEW 8.2.1.
07-13-2010 07:43 AM
- Mark as New
- Bookmark
- Subscribe
- Mute
- Subscribe to RSS Feed
- Permalink
- Report to a Moderator
Of course, ten minutes after I post, I find the originator of the timed loop method of benchmarking. It was posted by tst in this community nugget.
07-13-2010 07:46 AM
- Mark as New
- Bookmark
- Subscribe
- Mute
- Subscribe to RSS Feed
- Permalink
- Report to a Moderator
I rarely need to actually do profiling on my code, but it's always useful to have this.
@DFGray wrote:
Time/date in seconds has millisecond resolution on Windows.
This is the case in Window 7, but I can say for sure that in Windows XP the actual resolution is around 16 ms. If you need a 1 ms accuracy in XP, you should use the tick count.
I saw this method recently on these forums, but was unable to find it again. My thanks to whoever posted it, and apologies for not properly attributing it.
To save people some time, I assume you're refering to this. I don't remember exactly how I came up with the idea (I think it just came to me one day), but unfortunately I can say that it only happened AFTER I wrote some scripting code to generate the wrapper automatically. ![]()
___________________
Try to take over the world!
07-15-2010 08:54 AM
- Mark as New
- Bookmark
- Subscribe
- Mute
- Subscribe to RSS Feed
- Permalink
- Report to a Moderator
With the advent of multi-core CPU's benchmarking is tricky when trying to eek out a couple of nanoseconds here or there since the OS scheduler could schedule different tests across a different set of cores.
But using the Timed Sequence we can target the code to a specific core. I first watch my Windows task manager to see which cores are being used. On my home machine I have eight cores and usually core 2 is idle. I set up the Timed Sequence to run in Core 2 so I can get uninterupted numbers.
Just another tip to add to the pile.
Ben


