-
Analysis & Computation
305 -
Development & API
2 -
Development Tools
1 -
Execution & Performance
1,027 -
Feed management
1 -
HW Connectivity
115 -
Installation & Upgrade
267 -
Networking Communications
183 -
Package creation
1 -
Package distribution
1 -
Third party integration & APIs
288 -
UI & Usability
5,447 -
VeriStand
1
- New 3,051
- Under Consideration 4
- In Development 4
- In Beta 0
- Declined 2,638
- Duplicate 711
- Completed 338
- Already Implemented 114
- Archived 0
- Subscribe to RSS Feed
- Mark as New
- Mark as Read
- Bookmark
- Subscribe
- Printer Friendly Page
- Report to a Moderator
Trends and analytical features in the Profile Performance and Memory tool
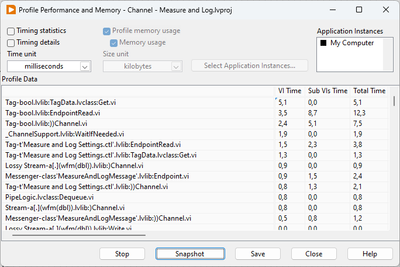
When looking for unexpected behaviour in time or memory usage of a project the Profiler is useful and easier than the execution tracer, but it could be made much more useful by adding the ability to monitor for changes and analyse the issues.
Issue:
Currently detecting how the memory or run counts e.g. of a VI changes over time you have to take snapshots, save them and then compare the values in e.g. Excel. (which the saved traces do not directly fit into either...)
Proposed feature: Trends
It would be nice if you could just set the tool to automatically sample and log all/selected numbers regularly and then be able to view the trends.
Proposed feature: Automated Analysis
Having trends will help in manually detecting issues, but the profiler could also have tools that helped you in this, e.g. highlighting which VIs show a continous growth in memory. This could also then be expanded by being able to call a VI analyzer on any given VI - preferably made/set up to identify possible reasons for a memory leak e.g. (unclosed references, continous array building e.g.).
You must be a registered user to add a comment. If you've already registered, sign in. Otherwise, register and sign in.

