- Subscribe to RSS Feed
- Mark Topic as New
- Mark Topic as Read
- Float this Topic for Current User
- Bookmark
- Subscribe
- Mute
- Printer Friendly Page
Workspace Data Rendering
Solved!12-09-2011 01:01 PM - edited 12-09-2011 01:01 PM
- Mark as New
- Bookmark
- Subscribe
- Mute
- Subscribe to RSS Feed
- Permalink
- Report to a Moderator
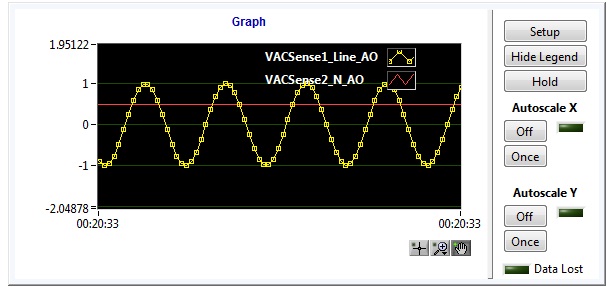
- the model runs at 5000Hz, and generates the sine point by point internally.


Solved! Go to Solution.
12-09-2011 02:15 PM
- Mark as New
- Bookmark
- Subscribe
- Mute
- Subscribe to RSS Feed
- Permalink
- Report to a Moderator
When you say "Workspace Setup window" I assume you are referring to the setup window for the graph? I'm not able to reproduce the behavior your seeing using the shipping example 'Sinewave Delay'. Do you see the same behavior with the sinewave model in the shipping example?
If not, could you post your project files and model?
The graph subscribes to the UDP stream for a channel, and if it is not decimated, it stream should contain all the points for the channel. So the behavior you're seeing isn't expected. Is it possible you're decimating your model or something else in the NIVS engine?
12-09-2011 02:33 PM
- Mark as New
- Bookmark
- Subscribe
- Mute
- Subscribe to RSS Feed
- Permalink
- Report to a Moderator
Yes Devin, I meant the setup window for the graph
Here is the LV model attached. I haven't checked the signal yet on the scope...
thx.
L.
12-09-2011 07:28 PM - edited 12-09-2011 07:29 PM
- Mark as New
- Bookmark
- Subscribe
- Mute
- Subscribe to RSS Feed
- Permalink
- Report to a Moderator
Ok, some more food for thoughts here:
- on a separate scope, the signal shows that the sine wave only updates every 1ms, despite the fact the PCL was at 5000Hz, and decimation of the model was at 1.
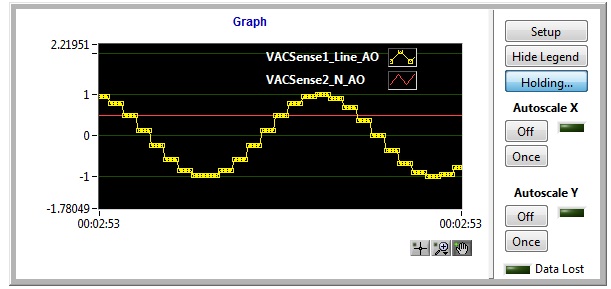
- I decreased my PCL loop rate down to 1000Hz, and the Workspace windows, when set with a decimation of 1, is now ok,. meaning that the flat sections are gone.
This means that despite a PCL of 5000Hz, the sine was being produced at a max rate of 1000Hz...and hence the flat sections on the graph... I don't know why...
Note that the target is a RT machine with a PCI 6723 AO card.
I am going to try the same thing with a PCIe 6343.
L.
12-09-2011 08:14 PM - edited 12-09-2011 08:14 PM
- Mark as New
- Bookmark
- Subscribe
- Mute
- Subscribe to RSS Feed
- Permalink
- Report to a Moderator
Ok, final tests show:
- both 6343 AO and 6723 AO show the same behavior using VS, that is I cannot generate my data above 1000Hz, despite PCL set at 5000Hz, and model decimation = 1.
- Back to LabVIEW RT, I run a timed loop with my same model VI than the one used in VS, using a software-timed generation, which presumably is the same as what VS is supposed to do, and the VI generates a sine as expected, that is I can loop no problem at 5000Hz, which is confirmed on a separate scope. So I am confident the code in my model vi is fine...
Can you help find the bottleneck... thx.
On the VS side, there is
- 15 AI, 31 DI on 6343: decimation 1, so 5000Hz
- 8 AO, 7 DO on 6723: decimation 1, so 5000Hz (supposedly)
- one custom device: parallel mode, 5000Hz
- 2 models : decimation 1, so 5000Hz (supposedly) : 1 is the sine generation, the other one, is essentially a feedthrough, nothing is done with it at the moment.
The system channel data returns ~ 5000Hz..
L.
12-09-2011 08:37 PM
- Mark as New
- Bookmark
- Subscribe
- Mute
- Subscribe to RSS Feed
- Permalink
- Report to a Moderator
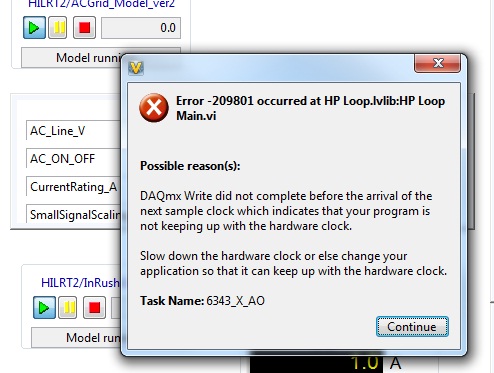
Lastly, I simplified my system definition file by ditching every I/Os except the ones for the test, so just a couples of AI,AOs. One model only, no more custom device: same result. This times, VS returns the error below:
So what is going on ?
Thx.
L.
12-12-2011 12:00 PM - edited 12-12-2011 12:01 PM
- Mark as New
- Bookmark
- Subscribe
- Mute
- Subscribe to RSS Feed
- Permalink
- Report to a Moderator
... and finally, I am also using the Stimulus profile editor to create my sine signal. It looks like the generation is based on the PCL rate, so the same thing happens, the digitizing rate at which the sine is generated is not going past 1000Hz.
L.
12-12-2011 03:04 PM
- Mark as New
- Bookmark
- Subscribe
- Mute
- Subscribe to RSS Feed
- Permalink
- Report to a Moderator
Laurent,
I would recommend looking at the "Model Count" system channel to see if your model is running late. I looked at your code, and it looks very simple, so I wouldn't expect any problems with it, but I was also missing a subVI you used. I removed the subVI and compiled it, and it ran fine on my system alonside a PXI-6723.
Also take a look at your CPU usage on your RT target, as well as the other "Count" channels (HP Count, LP Count, LP Data Count) to see if anything's running late. Another thing to check would be the timing settings of your chassis: are you using hardware timing for your DAQ card? Are you syncing the PCL to DAQ?
If you can post all of your project files and compiled model, I can take a look to see if there are any strange settings.
Regards,
Devin
12-12-2011 07:11 PM - edited 12-12-2011 07:16 PM
- Mark as New
- Bookmark
- Subscribe
- Mute
- Subscribe to RSS Feed
- Permalink
- Report to a Moderator
Devin,
None of the count indicate lateness. CPU is < 50% on the quad-processor targed. I changed the timing to hardware and there is still the same issue with my main definitition file.
However, using the simplified definition file, and using the Stimulus profile, with 5000Hz, and the timing source Settings = DAQ Timing, behavior is as expected, that is, 200us step intervals.
When I put the model back in line, I am back to 1000ms, however looking closely at the scope trace, it appears that even though it looks like the digitizing steps update every 1000ms, there are actually small digitizing spikes every 200ms. When I set back the hardware at actually 1000Hz, these dissapear. So what I suspect is that the digitizing rate / loop time is actually 200us as it should, and somewhere, something is only updating my AO at 1000ms, which may be a variable rouding in the model to ms, or the like... So tomorrow I will check my main system def file step by step to see where the issue is and will let you know.
I think one key thing here is what you said about using timing source Settings = DAQ Timing. Is it equivalent to set a timedloop with a clock being sourced from a hardware resource as opposed to the OS loop time?
Thx.
Laurent
12-15-2011 11:45 AM
- Mark as New
- Bookmark
- Subscribe
- Mute
- Subscribe to RSS Feed
- Permalink
- Report to a Moderator
Part 1 of 2...
Still no luck here. Here are the files used in the model

