- Subscribe to RSS Feed
- Mark Topic as New
- Mark Topic as Read
- Float this Topic for Current User
- Bookmark
- Subscribe
- Mute
- Printer Friendly Page
Memory Leak in File Writes?
02-29-2016 12:47 PM
- Mark as New
- Bookmark
- Subscribe
- Mute
- Subscribe to RSS Feed
- Permalink
- Report to a Moderator
felipefoz wrote:
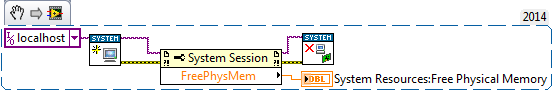
We have been using this code to retrieve free memory, as labview node doesn't report the real available memory.
This returns the memory value in kB.

Yes, MemAvailable is OK, although it makes a potentially questionable assumption (IIRC, that half of the page cache can't be evicted). It's not present in 2013/2014 though, since it was only introduced in the 3.14 kernel.
03-16-2016 03:42 AM
- Mark as New
- Bookmark
- Subscribe
- Mute
- Subscribe to RSS Feed
- Permalink
- Report to a Moderator
Hi,
I was wondering if anyone has the right data to read from /proc/self/stat to get memory used by the real time application only?
Looking at this link http://brokestream.com/procstat.html is it the vsize I would want to read? And is the output the same amount of lines and the same order as the link?
03-18-2016 09:20 AM
- Mark as New
- Bookmark
- Subscribe
- Mute
- Subscribe to RSS Feed
- Permalink
- Report to a Moderator
Mrmas,
I think it really depends on what you want to get. The SysApi memory reporting has resolved the noted problem that led to the creation of this thread in the first place, but memory reporting in Linux is tricky (as is the case with any multiprocess system with shared, copy-on-write pages that doesn't always account for kernel memory use since that accounting requires memory, etc. etc.).
So, revisiting your actual question, what specifically are you looking for? What do you intend to use this information for or to detect? The answers you give affect the (current) correct answer on what to look for.
As an aside, you probably want to use /proc/$PID/status, a little more complete (includes stat and mstat figures) and is a bit more readable.
03-18-2016 09:44 AM
- Mark as New
- Bookmark
- Subscribe
- Mute
- Subscribe to RSS Feed
- Permalink
- Report to a Moderator
Hi, thanks for the reply.
First if i use /proc/$PID/status does that reference the application or do i need the PID number from somewhere first?
Second my plan when using this reading was to get the memory usage of just the labview RT application. I see a decline in free memory reported over time and wanted to see if it is a memory leak or a memory growth problem with my application.
You say the sysapi memory reporting issue has been solved, does that mean that if my application shows dropping free memory over time in MAX for eksample, that i am eating up memory over time?
Regrads
Mas
03-18-2016 09:53 AM
- Mark as New
- Bookmark
- Subscribe
- Mute
- Subscribe to RSS Feed
- Permalink
- Report to a Moderator
If you want to get the memory use of the LabVIEW RT process, you should use /proc/$(pidof lvrt)/status. This is safe to use for either direct reading or the use of the SystemExec utility VI. Most places will call out the use of /proc/self/status for this, but there will be a different process used for the SystemExec use-case (as is the case anytime you spawn a new process to do something).
The issue where VFS page cache being reported as "used" memory in the sysapi (used by MAX) has been resolved, so a continually dropping free memory could indicate that there is a continual growth of memory use somewhere in your system. It's reasonable to check the LVRT memory use to see if there's something in your application that is continually leaking/using memory.
11-04-2016 04:12 AM
- Mark as New
- Bookmark
- Subscribe
- Mute
- Subscribe to RSS Feed
- Permalink
- Report to a Moderator
This may be fixed in the distibuted system manager, but it is still an issue with the system configuration API property. I have tried in both 2014 and 2015.
This is a major issue for any applications that are supposed to run 24/7 as monitoring the health of the device (CPU, memory, disk space) is common practice. I have had to use the distributed system manager shared variable to read available memory which involves installing more software to the cRIO (and reducing the available meory to start with).
I would have hoped that NI would fix this properly as from the linked articals and posts its been know about for a while.
LabVIEW Architect, TestStand Architect
11-07-2016 09:40 AM
- Mark as New
- Bookmark
- Subscribe
- Mute
- Subscribe to RSS Feed
- Permalink
- Report to a Moderator
Can you clarify what you would like fixed? From your code snippet it looks like you are attempting to monitor resources by checking free physical memory. If the fix you're looking for is, for example, for free physical memory to go up when user space applications free memory, that would not be an appropriate fix, as that memory may not be free physical memory from the Linux perspective, and we would like this data to report accurately with respect to the operating system. If what you're looking for us more granular reporting of the various states memory can be in (as you would see in OS's own reporting), let us know what would be most useful. As you can see from e.g. https://access.redhat.com/solutions/406773 there is a lot of data available and while we try to boil it down to what is most useful to most people, we know that not everyone has the same preferences for what they want to see there.
11-07-2016 10:14 AM
- Mark as New
- Bookmark
- Subscribe
- Mute
- Subscribe to RSS Feed
- Permalink
- Report to a Moderator
Hi Scot,
I think the common complaint is that "Free Physical Memory" is a pretty useless statistic on Linux RT. I can't think of any practical use for it. What most users expect from this attribute is something likew what Jon is asking for --- how much memory is available to the application.
Eric
11-07-2016 10:37 AM
- Mark as New
- Bookmark
- Subscribe
- Mute
- Subscribe to RSS Feed
- Permalink
- Report to a Moderator
That does make sense. But I don't want to "fix" the Free Physical Memory stat by repurposing it for that; that would be misleading. What people are looking for here is a new stat, correct? Or is there some name we could give it that would mean "Free Physical Memory on Phar Lap and VxWorks, and memory available to the application on Linux"?
11-07-2016 11:03 AM
- Mark as New
- Bookmark
- Subscribe
- Mute
- Subscribe to RSS Feed
- Permalink
- Report to a Moderator
Sure, if you don't want to repurpose the existing one, a new one makes sense.
Does "Available Memory" seem like an appropriate name/stat?
