- Subscribe to RSS Feed
- Mark Topic as New
- Mark Topic as Read
- Float this Topic for Current User
- Bookmark
- Subscribe
- Mute
- Printer Friendly Page
Controlling a multiplexer with digital outputs
03-21-2007 04:04 PM
- Mark as New
- Bookmark
- Subscribe
- Mute
- Subscribe to RSS Feed
- Permalink
- Report to a Moderator
I am currently trying to use a 16-1 line multiplexer as my analog input to a DAQ6009 ,as I have 16 analog sensors and thus not enough analog input lines I am trying to use a multiplexer but I do not know how to program my Labview program to change the values the select inputs of the multiplexer recieve. As it is a 16-1 line multiplexer it has 4 select controls so therefore I need my program to count from 0000 to 1111 so that each value from each sensor can be read. Any help on how to achieve this would be much appreciated.
Many thanks,
James
03-21-2007 08:26 PM - edited 03-21-2007 08:26 PM
- Mark as New
- Bookmark
- Subscribe
- Mute
- Subscribe to RSS Feed
- Permalink
- Report to a Moderator
Easiest is probably a for loop with the iteration terminal wired to the data input of a DAQ Assistant. If you configure the DAQ Assistant for line ouput, you use the number to Boolean Array function between the iteration terminal and the data input. If you configure the DAQ Assistant for port output, then you use the Build Array function in between.
Message Edited by Dennis Knutson on 03-21-2007 07:27 PM
03-22-2007 04:46 AM
- Mark as New
- Bookmark
- Subscribe
- Mute
- Subscribe to RSS Feed
- Permalink
- Report to a Moderator
Thanks for the reply it sound like it should work but would you be able to explain it to me in simplier terms, im not very experienced with Labview yet. Much appreciate the help.
Many thanks,
James
03-22-2007 08:13 AM - edited 03-22-2007 08:13 AM
- Mark as New
- Bookmark
- Subscribe
- Mute
- Subscribe to RSS Feed
- Permalink
- Report to a Moderator
What exactly is confusing. Is it the DAQ Assistants or the for loop? For help with DAQ, I would recomend going to http://zone.ni.com/devzone/cda/tut/p/id/5434. The DAQ Assistant allows you to get up and running quirckly with a variety of basic DAQ tasks. What I did was create on assistant for digital output/line mode (mux control). The other one is for analog input. When you drop an assistant on the block diagram, you will get a series of windows that will walk you through the process of setting things up.
The for loop has an interation terminal. This is the little 'i' in one corner. With each iteration of the loop, the count is incremented. The ount starts at zero. So, it is just a matter of converting this number to the data type that the DAQ Assistant requires. With this type of digital output, the assistant requires an array of Booleans (True/False) that define the logic states of the digital outputs. There is a built-in function in LabVIEW that will convert a number to a Boolean array.
For learning LabVIEW basics, one place to start is http://www.ni.com/academic/lv_training/how_learn_lv.htm.
Message Edited by Dennis Knutson on 03-22-2007 07:14 AM
03-23-2007 09:01 AM
- Mark as New
- Bookmark
- Subscribe
- Mute
- Subscribe to RSS Feed
- Permalink
- Report to a Moderator
James
03-23-2007 09:16 AM
- Mark as New
- Bookmark
- Subscribe
- Mute
- Subscribe to RSS Feed
- Permalink
- Report to a Moderator
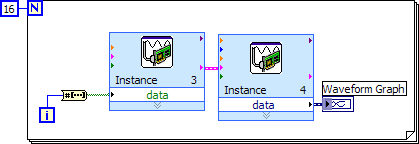
The second DAQ Assistant is one for acquiring the analog signal. The wire between the two is the error in/error out connections. The colors of this wire changed with LabVIEW 8.x.
Use the Split Signal function to wire channels to separate charts.
03-27-2007 05:30 AM
- Mark as New
- Bookmark
- Subscribe
- Mute
- Subscribe to RSS Feed
- Permalink
- Report to a Moderator
Hi again,
I tried running the program and it gave me an error. Im not sure if its something I setup wrong or what. I have attached the problem below, hopefully you might be able to tell me what has gone wrong.
Thanks again,
James
03-27-2007 06:57 AM
- Mark as New
- Bookmark
- Subscribe
- Mute
- Subscribe to RSS Feed
- Permalink
- Report to a Moderator
03-27-2007 09:53 AM
- Mark as New
- Bookmark
- Subscribe
- Mute
- Subscribe to RSS Feed
- Permalink
- Report to a Moderator
Cheers,
That work a charm, i thought it was something that i had configured wrong with the daq assistant. Remember I was asking about plotting the output of each sensor on a seperate graph, how exactly did you say to do that?
03-27-2007 10:15 AM
- Mark as New
- Bookmark
- Subscribe
- Mute
- Subscribe to RSS Feed
- Permalink
- Report to a Moderator
