- Subscribe to RSS Feed
- Mark Topic as New
- Mark Topic as Read
- Float this Topic for Current User
- Bookmark
- Subscribe
- Mute
- Printer Friendly Page
xy graph problem of repeating same plots
Solved!07-23-2015 02:01 AM
- Mark as New
- Bookmark
- Subscribe
- Mute
- Subscribe to RSS Feed
- Permalink
- Report to a Moderator
Hi there. I have this problem of graph plots in my XY Graph.
At first i thought it was just a line joining the first and last points. But it might also be because the graph is replotting my points again and again. I have a feeling that after my last point, the graph goes back to plot my first point thats why its all joined up in one loop.
Can someone advise me on this? I just want a line whereby the ends do not meet.
I have everythong ready except displaying on the graph nicely. Desperate! Thank you.
Solved! Go to Solution.
07-23-2015 02:33 AM - edited 07-23-2015 02:36 AM
- Mark as New
- Bookmark
- Subscribe
- Mute
- Subscribe to RSS Feed
- Permalink
- Report to a Moderator
Hi sneakers,
I have a feeling that after my last point, the graph goes back to plot my first point thats why its all joined up in one loop.
Yes, it does.
Because you use uninitialized shift registers/feedback nodes!
What's the reason for the outer FOR loop, which iterates just once?
Why do you scan for the timestamp that complicatoed? Why not read a timestamp directly with ScanFromString?
07-23-2015 02:46 AM
- Mark as New
- Bookmark
- Subscribe
- Mute
- Subscribe to RSS Feed
- Permalink
- Report to a Moderator
Thank you for your response GerW! 🙂 🙂
1. I put the outer for loop because I want to clear the graph first when I press run. This was my solution to my earlier problem when the graph would just extend and append when i stop and start again.
2. I am actually retrieving data from a database so the time is according to the user interface. Thats why i cant wire the time stamp directly?
Oops haha I had a feeling it was joine dup all in a loop. How do i make it such that the points wont be back to back? I just want to display the points according to the dates the user chose (which is in between First Date and Last Date).
07-23-2015 02:52 AM
- Mark as New
- Bookmark
- Subscribe
- Mute
- Subscribe to RSS Feed
- Permalink
- Report to a Moderator
Hi Sneaker,
I just want to display the points according to the dates the user chose (which is in between First Date and Last Date).
Then you should filter just those points. And you should initialize any shift registers/feedback nodes you use in your VI…
07-23-2015 03:30 AM
- Mark as New
- Bookmark
- Subscribe
- Mute
- Subscribe to RSS Feed
- Permalink
- Report to a Moderator
GerW,
Is this the feedback node you were talking about? Because i didnt use any shift registers. What do you mean by initialising my feedback nodes? Im afraid i dont understand.
Ive tried putting constant value (eg. 4) to the smaller for loop but it doesnt solve my problem of my data displaying in a loop.
07-23-2015 03:38 AM
- Mark as New
- Bookmark
- Subscribe
- Mute
- Subscribe to RSS Feed
- Permalink
- Report to a Moderator
Hi sneaker,
Is this the feedback node you were talking about?
Yes, those are the feedback nodes. The context help will also name them this way, when you hover the mouse over them!
What do you mean by initialising my feedback nodes? Im afraid i dont understand.
The LabVIEW help explains, how to initialize feedback nodes (and shift registers, which are basically the same). Did you read the help?
07-23-2015 04:14 AM
- Mark as New
- Bookmark
- Subscribe
- Mute
- Subscribe to RSS Feed
- Permalink
- Report to a Moderator
Hi GerdW,
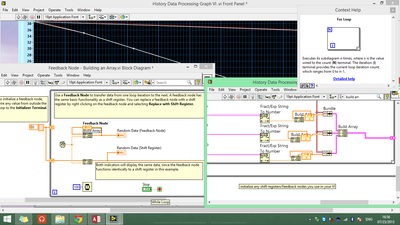
According to the context help,
Feedback Node
Stores data from one VI execution or loop iteration to the next.
I looked at the example and it says to initialise a feedback node, i have to wire smth into the intitialiser terminal from outside the loop. But then the whole stretch of wires become broken.
Is there no other way to stop the plots from plotting in a loop?
07-23-2015 04:20 AM
- Mark as New
- Bookmark
- Subscribe
- Mute
- Subscribe to RSS Feed
- Permalink
- Report to a Moderator
07-23-2015 04:34 AM
- Mark as New
- Bookmark
- Subscribe
- Mute
- Subscribe to RSS Feed
- Permalink
- Report to a Moderator
Hi GerdW,
I'm lost as to what i have to do now. 😞
07-23-2015 04:37 AM
- Mark as New
- Bookmark
- Subscribe
- Mute
- Subscribe to RSS Feed
- Permalink
- Report to a Moderator
Hi Sneakers,
But then the whole stretch of wires become broken.
I don't see any broken wires in your image…
Is there no other way to stop the plots from plotting in a loop?
Create the plots using autoindexing output tunnels in your loop. Build the plots just once after the FOR loop finishes…


