- Subscribe to RSS Feed
- Mark Topic as New
- Mark Topic as Read
- Float this Topic for Current User
- Bookmark
- Subscribe
- Mute
- Printer Friendly Page
waveform graph with timestamp
09-15-2007 08:37 AM
- Mark as New
- Bookmark
- Subscribe
- Mute
- Subscribe to RSS Feed
- Permalink
- Report to a Moderator
09-15-2007 10:36 AM - edited 09-15-2007 10:36 AM
- Mark as New
- Bookmark
- Subscribe
- Mute
- Subscribe to RSS Feed
- Permalink
- Report to a Moderator
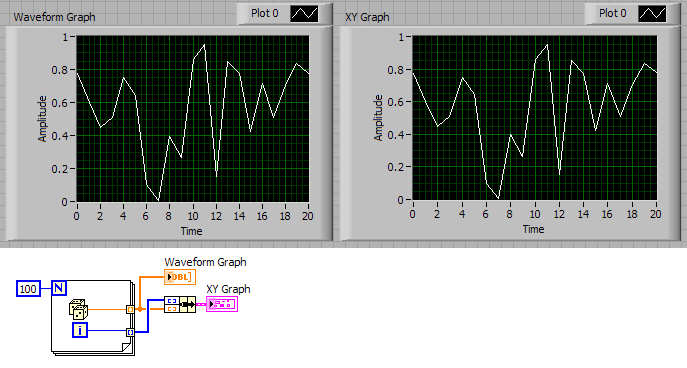
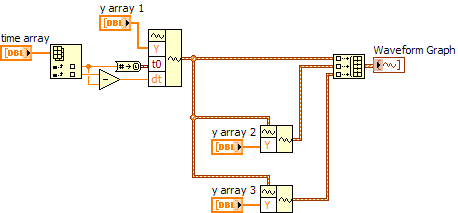
I don't notice a difference between an XY Graph and a Waveform Graph if the dt on both are the same and assuming all of the other attributes (interpolation, point style, range, etc.) are the same as shown below. To create a waveform graph and assuming that the dt is constant in your time array, you can do something like the other image. An XY graph is normally used only when the intervals on the x axis are not constant. If you see a difference, you should post your VI (with data in the arrays) so that someone can look at it.
Message Edited by Dennis Knutson on 09-15-2007 09:38 AM
09-16-2007 07:56 PM
- Mark as New
- Bookmark
- Subscribe
- Mute
- Subscribe to RSS Feed
- Permalink
- Report to a Moderator
Hello
I wired the Waveform graph following the build waveshape function and the X axis is showing the time starting at 1903, but when I take the same daa arrays and send them to a XY Graph the X axis shows correct. Does anyone have a suggestion for this.....
Thanks
Tim C.
09-16-2007 08:10 PM
- Mark as New
- Bookmark
- Subscribe
- Mute
- Subscribe to RSS Feed
- Permalink
- Report to a Moderator
09-16-2007 08:14 PM
- Mark as New
- Bookmark
- Subscribe
- Mute
- Subscribe to RSS Feed
- Permalink
- Report to a Moderator
09-16-2007 09:48 PM
- Mark as New
- Bookmark
- Subscribe
- Mute
- Subscribe to RSS Feed
- Permalink
- Report to a Moderator
