- Subscribe to RSS Feed
- Mark Topic as New
- Mark Topic as Read
- Float this Topic for Current User
- Bookmark
- Subscribe
- Mute
- Printer Friendly Page
serial read, and data import into spreadsheet
08-17-2011 09:55 AM
- Mark as New
- Bookmark
- Subscribe
- Mute
- Subscribe to RSS Feed
- Permalink
- Report to a Moderator
@tgilbert wrote:
Sorry - RS232 serial message packet is: 1 start bit; 7 data bits; 1 parity bit; and 2 stop bits. So I guess I read 11 bits, strip bits 1-6, and reassemble into data?
NO. You don't read bits at all and you don't strip anything. When you do a read, all you get is the data. Everything else is done for you by specifying the correct number of start/stop bits, number of data bits, etc.
08-17-2011 10:02 AM
- Mark as New
- Bookmark
- Subscribe
- Mute
- Subscribe to RSS Feed
- Permalink
- Report to a Moderator
Is this something you customize within the VISA Configure Serial Port vi (i.e. - change the number of data bits)?
08-17-2011 10:03 AM
- Mark as New
- Bookmark
- Subscribe
- Mute
- Subscribe to RSS Feed
- Permalink
- Report to a Moderator
Yes.
08-17-2011 10:25 AM
- Mark as New
- Bookmark
- Subscribe
- Mute
- Subscribe to RSS Feed
- Permalink
- Report to a Moderator
@tgilbert wrote:
Is this something you customize within the VISA Configure Serial Port vi (i.e. - change the number of data bits)?
Why are you even asking this? Surely you have context help turned on where all of the inputs/outputs (i.e. 'data bits') are fully documented.
08-17-2011 10:33 AM
- Mark as New
- Bookmark
- Subscribe
- Mute
- Subscribe to RSS Feed
- Permalink
- Report to a Moderator
There are few combinations in life as satisfying as a Serial Port, a noob, and Dennis.

08-17-2011 10:35 AM
- Mark as New
- Bookmark
- Subscribe
- Mute
- Subscribe to RSS Feed
- Permalink
- Report to a Moderator
I was expecting the answer was yes, but wanted to be sure. ![]()
08-22-2011 08:25 AM
- Mark as New
- Bookmark
- Subscribe
- Mute
- Subscribe to RSS Feed
- Permalink
- Report to a Moderator
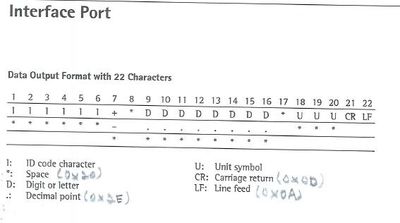
Here's the Data Output Formatting from the scale...
What I want to do is grab two pieces of information: the value; and the units. And, then display the value graphically and numerically. The units will be displayed and placed into the spreadsheet (worry about that later). I am using a string subset function to pull bytes 9-16 and then display them. The front panel shows the output I'm getting. I'm guessing that the data I'm working with is the first 22-bytes - am I wrong in thinking this? BTW, the bytes I'm displaying in "Bytes Written" represent the Esc P command - needed to request data from the scale. It's possible I'm using this incorrectly, too. Any thoughts? Thanks.
08-22-2011 08:49 AM
- Mark as New
- Bookmark
- Subscribe
- Mute
- Subscribe to RSS Feed
- Permalink
- Report to a Moderator
Here's block diagram and front panel.
08-22-2011 09:00 AM
- Mark as New
- Bookmark
- Subscribe
- Mute
- Subscribe to RSS Feed
- Permalink
- Report to a Moderator
Hi, you can use a string subset function for extracting the string to write in the excel sheet. For the value/data bytes, you want a plot of those right?.
For the graph: You can use a string to byte(considering your data bits is 😎 array and give it to a chart or graph depending on which you want to use.You can extract the unit bytes as a string and and give it to a property node for displaying the unit on besides the scale name.
For displaying the data numerically, you will need to use an array, you can than just send the array of numbers in to the array indicator and use a string indicator to display the units.
For the excel part, just write down the string you extracted in the first place as mentioned above.
PS: If the data is one value than you can use Decimate 1D array to separate the bytes and than combine them according to your will. Use a simple numeric indicator then.
08-22-2011 09:28 AM
- Mark as New
- Bookmark
- Subscribe
- Mute
- Subscribe to RSS Feed
- Permalink
- Report to a Moderator
Thanks. I do want want to plot the data. I tried to use a string subset to grab only the data I want, but I suspect I'm using it improperly - I'm only getting a character representation, and not the numeric data.


