- Subscribe to RSS Feed
- Mark Topic as New
- Mark Topic as Read
- Float this Topic for Current User
- Bookmark
- Subscribe
- Mute
- Printer Friendly Page
problem setting sampling rate
02-12-2008 01:03 PM
- Mark as New
- Bookmark
- Subscribe
- Mute
- Subscribe to RSS Feed
- Permalink
- Report to a Moderator
For sampling rates <1kHz, I get an error message that the clock rate specified is less than the minimum conversion rate of the ADC, and the data is spaced out with clusters of 0's. This wouldn't be a problem, since we'll always be using a sampling rate >1kHz, except that for sampling rates >1 kHz the actual data collection occurs at ~260 Hz (regardless of the input value for the sampling rate.
I've tried changing the samples per channel to adjust the buffer size on the DAQmx Timing, but with no change in the result.
The output source should be able to keep up with signals up to 1 MHz, so I do not think that is the problem.
It may be how I have wired the VI. I should mention that the AC output from the LabView board is fine up to 4 MS/s, which makes me think it's probably not the computer. (We're using an S-series board.)
Any suggestions? Images of the block diagram are attached.
Thanks,
Michelle
02-13-2008 12:50 PM
- Mark as New
- Bookmark
- Subscribe
- Mute
- Subscribe to RSS Feed
- Permalink
- Report to a Moderator
So if I am understanding your problem correctly, no matter what value you set the Sample Rate control, it only samples at 260 Hz? How are you determining that this is the actual rate the data is being sampled? Also, what model S-Series board do you have?
I would suggest using the Test Panels in MAX or a simple example program to verify the results. This way we can determine if this a problem with the programming or with the card itself.
Chris Delvizis
National Instruments
02-13-2008 01:16 PM
- Mark as New
- Bookmark
- Subscribe
- Mute
- Subscribe to RSS Feed
- Permalink
- Report to a Moderator
Hi Chris,
I'm determining the sampling rate by applying a constant DC signal for 30 s followed by dropping the DC signal to ground. Based on the number of points I get for this 30 s before the signal goes to ground, I estimate that the sampling rate is ~260 Hz.
We have the PCI-6110 board.
Could you give me some more specifics about how I could use the Test Panels to determine whether the board or the programming is the cause of the problem?
Thanks,
Michelle
02-14-2008 04:16 PM
- Mark as New
- Bookmark
- Subscribe
- Mute
- Subscribe to RSS Feed
- Permalink
- Report to a Moderator
Your acuisition code seems to be correct. I am not convinced that you are correctly calculating your sampling rate. What is the sampling rate that you have set for the input? What is the number of samples you are receiving in this 30 sec time period? I have attached a link below on calculating your actual sample rate.
Also, the number if samples that are displayed in the waveform graph will only be the number of samples in the buffer. If you want to view the full history then try using a waveform chart.
You can view the Test Panels in the Measurement and Automation Explorer by right-clicking on your device and going to Test Panels. From there you can see if you get similiar results.
How Is the Actual Scan Rate Determined When I Specify the Scan Rate for My Data Acquisition?
http://digital.ni.com/public.nsf/allkb/5782F1B396474BAF86256A1D00572D6E?OpenDocument
Chris Delvizis
National Instruments
02-15-2008 08:45 AM
- Mark as New
- Bookmark
- Subscribe
- Mute
- Subscribe to RSS Feed
- Permalink
- Report to a Moderator
Hi Chris,
I've tried a range of sampling rates from 100 Hz to 10 kHz. For rates <1 kHz, I get the error message described in my first post. For 1 kHz or more, I've been calculating the actual sampling rate using the data in from the "Write to Spreadsheet" vi, not the waveform graph. In the spreadsheet, I always get ~7740 points for the 30 s signal, regardless of whether the sampling rate I've set is 1 kHz, 5 kHz, or 10 kHz.
Perhaps LabView is sampling at the correct rate, but writing to the spreadsheet file more slowly. Is it possible to check/change this?
I opened the Test Panels and recorded some data, but I can't figure out how to get the actual sampling rate from the waveform graph. Is there a way to get this data in a chart so that I can see the number of points actually recorded?
Thanks again for your help,
Michelle
02-18-2008 11:01 AM
- Mark as New
- Bookmark
- Subscribe
- Mute
- Subscribe to RSS Feed
- Permalink
- Report to a Moderator
I did some tests and it looks the problem is in fact with the Write to Spreadsheet VI. Instead try using the Export Waveforms to Spreadsheet File VI. You can find this under Programming » Waveform » Wfm File I/O. This should save all of your points along with timing data.
Also, to put the data in a chart you can use a Waveform Chart rather than a Waveform Graph on your front panel. You can then wire the data to the chart on your block diagram.
Chris Delvizis
National Instruments
02-20-2008 05:13 PM
- Mark as New
- Bookmark
- Subscribe
- Mute
- Subscribe to RSS Feed
- Permalink
- Report to a Moderator
Hi Chris,
It looks like that was the problem. I rewired the VI to use the Export Waveform to Spreadsheet VI and a waveform chart instead of the Write to Spreadsheet VI and the graph. It's now sampling correctly. For example, I've posted the results of a 100 Hz waveform sampled at 1 kHz.
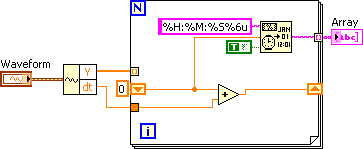
Now I'm just having one small problem that's more of an annoyance than anything... The time data doesn't include any decimal points after the seconds place. I've tried changing this by opening the front panel for the Export Waveform to Spreadsheet VI and adjusting the format and precision of the time data, but it doesn't seem to change what's recorded in the file. I'm including a screen snap that shows how I've rewired the VI as well as the menu for the format and precision for the Export Waveform to Spreasheet VI so you can see what settings I've been changing.
If you or anyone else has any suggestions on how to get it to show some decimal points in the time readout, that'd be really convenient. If not, I can always generate the time column now that I know the VI is sampling at the correct rate.
Thanks for your help,
Michelle
02-20-2008 06:13 PM
- Mark as New
- Bookmark
- Subscribe
- Mute
- Subscribe to RSS Feed
- Permalink
- Report to a Moderator
02-21-2008 01:00 PM
- Mark as New
- Bookmark
- Subscribe
- Mute
- Subscribe to RSS Feed
- Permalink
- Report to a Moderator
Thanks Dennis. We are using Version 8.2, and that worked very well.
OK, I think this is my last question... Within the Waveform Time to Date Time String SubVI or in another part of the VI, is it possible to have the absolute time (which is what is currently recorded) converted to a relative time (starting at t0 = 0.000 s and counting up).
Just trying to fine tune this now so that data processing will be faster. It's definitely working well as is.
Thanks again for all the help,
Michelle
02-21-2008 02:00 PM - edited 02-21-2008 02:00 PM
- Mark as New
- Bookmark
- Subscribe
- Mute
- Subscribe to RSS Feed
- Permalink
- Report to a Moderator
Yes, you can do this as well. I normally just use the Write to Spreadsheet File but you can modify the Export Waveforms by doing somethinkg like is shown below. Instead of the functions Get Waveform Time Array and Waveform Time to Date Time String, this code will generate a series of relative times starting at 00:00:00. Note that this works on 8.5 and there may be some slight differences in the creation of the time string with your version. I don't have 8.2 so I can't test it. Also, since you are changing the functionality of the Export Waveform function, be sure to save it with a new name and in a new location.
Message Edited by Dennis Knutson on 02-21-2008 01:00 PM
