- Subscribe to RSS Feed
- Mark Topic as New
- Mark Topic as Read
- Float this Topic for Current User
- Bookmark
- Subscribe
- Mute
- Printer Friendly Page
get a date and time in seconds
09-10-2017 02:51 AM
- Mark as New
- Bookmark
- Subscribe
- Mute
- Subscribe to RSS Feed
- Permalink
- Report to a Moderator
Hello everyone,
Last day i tried to do a timer vi..in that case i seen a vi which has this code snippet...which requires a conversion of timestamp to DBL.
after this conversion i get some value like 3.57845e+9...i would like to know how that particular value is generated in that snippet...
09-10-2017 06:50 AM
- Mark as New
- Bookmark
- Subscribe
- Mute
- Subscribe to RSS Feed
- Permalink
- Report to a Moderator
If you look at the Help file for Get Date/Time in Seconds function it says:
current time returns a timestamp of the LabVIEW system time. LabVIEW calculates this timestamp using the number of seconds elapsed since 12:00 a.m., Friday, January 1, 1904, Universal Time [01-01-1904 00:00:00].
So when you convert the timestamps to DBL it gives you a value like 3.57845e+9.
Ben64
09-10-2017 08:32 AM
- Mark as New
- Bookmark
- Subscribe
- Mute
- Subscribe to RSS Feed
- Permalink
- Report to a Moderator
You write that you "tried to do a timer vi". I presume that you were interested in elapsed times, i.e. "How long since the last time I checked, or since the program started running".
There are a number of functions on the Timing Palette (and one Hidden Gem) that are useful to learn about and use. First thing to realize is that Timing is a little imprecise on a Windows PC, as the computer isn't spending all of its "time" executing your LabVIEW program.
One interesting "feature" of Timing functions is that they (rarely) have Error In/Out connectors, but are free-floating. This has two consequences -- they are designed to take as little "time" as possible to run, but (because of Data Flow) you can't control precisely when (in a loop, for example) they will "tick". So if you need to "wait 50 msec between Function A and Function B that are connected via the Error Line", you need to surround the 50 msec Delay function with a Sequence Frame and tunnel the Error Line through it.
If you look at LabVIEW functions that employ time (or have TimeOuts), most of them use a millisecond clock (whereas the CPU's clock is in the GHz range). So if you want to measure elapsed time, you can read the Tick Count (a U32 in msec) before your loop and save it as t0, then (inside the loop) read the current Tick Count and subtract t0 to get elapsed Time in milliseconds (this is good for up to 7 weeks before it "rolls over"). You can also do the same thing with TimeStamps, but now you are dealing with more bytes of data (16 bytes for a TimeStamp, 8 bytes for a Dbl, but only 4 bytes for the U32 of the Tick Count) and more processing time.
But what if you want to time some code to see how fast it runs? Now you want as precise a clock as you can get. When you installed LabVIEW, you should also have gotten the VI Package Manager (VIPM, possibly found in the JKI folder in your Start Menu). Look in its list of Packages for "Hidden Gems from vi.lib" and install it -- it includes a High Resolution Relative Seconds VI, which uses the CPU clock to give you elapsed time estimates using the CPU's cycle clock for greater precision.
Bob Schor
09-10-2017 10:41 AM
- Mark as New
- Bookmark
- Subscribe
- Mute
- Subscribe to RSS Feed
- Permalink
- Report to a Moderator
Sh@ker wrote:
after this conversion i get some value like 3.57845e+9...i would like to know how that particular value is generated in that snippet...
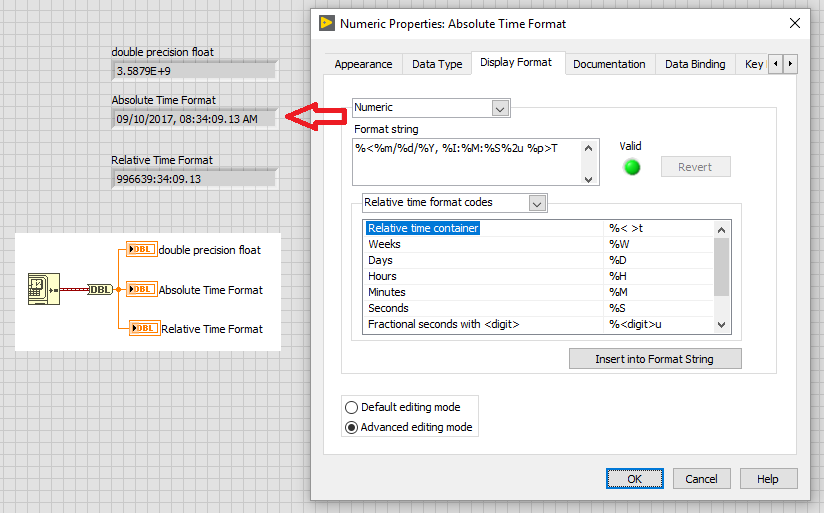
It is the same value, just with less resolution (coerced to DBL) and is based on the LabVIEW epoch as has been mentioned (you can find the definition here).
If you want to see the value in a more recognizable way, just change the format of the indicator. Same difference! 😄
All three indicator have the same "value", it is just displayed differently.


