- Subscribe to RSS Feed
- Mark Topic as New
- Mark Topic as Read
- Float this Topic for Current User
- Bookmark
- Subscribe
- Mute
- Printer Friendly Page
Tracking / Classification / Extracting Objects Trajectory Data Points
11-23-2021 04:07 AM - edited 11-23-2021 04:21 AM
- Mark as New
- Bookmark
- Subscribe
- Mute
- Subscribe to RSS Feed
- Permalink
- Report to a Moderator
Hello,
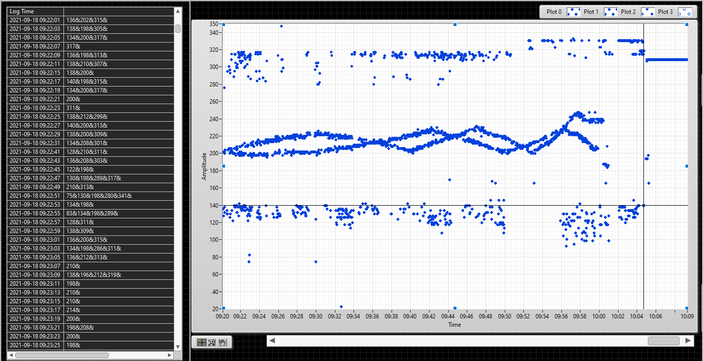
I Have Data points of Multiple Objects Trajectory which I had Recorded at a Specific time Interval as Shown in the Figure Below.
I want to Extract/ Track Multiple Objects Trajectory so for that I have Implemented GNN (Global Nearest Neighbor) but it wont work in case of Missing Data Points and when Object Trajectory Cross each other.
I have Attached the Data log File Kindly Help me Out in this Regard.
11-23-2021 09:18 AM
- Mark as New
- Bookmark
- Subscribe
- Mute
- Subscribe to RSS Feed
- Permalink
- Report to a Moderator
Perhaps you should post the GNN algorithm.
11-24-2021 01:52 AM
- Mark as New
- Bookmark
- Subscribe
- Mute
- Subscribe to RSS Feed
- Permalink
- Report to a Moderator
Kindly Check This File I have Implemented GNN Algorithm you can set gate Size Manually by Changing the constants in the Loop this code has a bug as it didn't give you the Track Trajectory Correctly
11-24-2021 02:21 AM
- Mark as New
- Bookmark
- Subscribe
- Mute
- Subscribe to RSS Feed
- Permalink
- Report to a Moderator
@mrjunaidkahn wrote:
Kindly Check This File I have Implemented GNN Algorithm you can set gate Size Manually by Changing the constants in the Loop this code has a bug as it didn't give you the Track Trajectory Correctly
There's no file.
11-24-2021 03:48 AM
- Mark as New
- Bookmark
- Subscribe
- Mute
- Subscribe to RSS Feed
- Permalink
- Report to a Moderator
Kindly Check this
11-24-2021 07:29 AM
- Mark as New
- Bookmark
- Subscribe
- Mute
- Subscribe to RSS Feed
- Permalink
- Report to a Moderator
@mrjunaidkahn wrote:
Kindly Check this
Lots of things don't make sense to me.
Lots of duplicate code...
Why convert from integer strings to integer, to double, to string, to integer, and then compare which strings is > or <?
I'd start with parsing the input file, something like this (although I can't say for sure what you're trying to do):
11-24-2021 10:09 AM
- Mark as New
- Bookmark
- Subscribe
- Mute
- Subscribe to RSS Feed
- Permalink
- Report to a Moderator
do you also need to label each trajectory, or
do you want to solely remove noise from a signal e.g.
you define a starting point via double-click in the input graph, and then calculate distances regarding to this initial value over and over again.
shouldn't you update the initial position after a while?
11-25-2021 11:47 AM
- Mark as New
- Bookmark
- Subscribe
- Mute
- Subscribe to RSS Feed
- Permalink
- Report to a Moderator
I would just read the file as follows for further processing:
You seem to do a lot of 2D trigonometry, so I recommend to use a complex datatype!
11-25-2021 01:11 PM - edited 11-25-2021 02:15 PM
- Mark as New
- Bookmark
- Subscribe
- Mute
- Subscribe to RSS Feed
- Permalink
- Report to a Moderator
Just to give you some ideas, here's a tiny codelet to replace screenfuls of your Rube Goldberg code to create a cleaned up version of your first xy graph.
11-25-2021 08:44 PM
- Mark as New
- Bookmark
- Subscribe
- Mute
- Subscribe to RSS Feed
- Permalink
- Report to a Moderator
Altenbach used the technique that once a wise scholar said
"Complex" just isn't "Real", it is also "Imaginary" (at the same time ...).
- Bob Schor
Soliton Technologies
New to the forum? Please read community guidelines and how to ask smart questions
Only two ways to appreciate someone who spent their free time to reply/answer your question - give them Kudos or mark their reply as the answer/solution


