- Subscribe to RSS Feed
- Mark Topic as New
- Mark Topic as Read
- Float this Topic for Current User
- Bookmark
- Subscribe
- Mute
- Printer Friendly Page
Should I disable debugging for the VIs in my built exe?
01-07-2021 01:21 PM
- Mark as New
- Bookmark
- Subscribe
- Mute
- Subscribe to RSS Feed
- Permalink
- Report to a Moderator
Hi!
I have a very large LabVIEW application and I am trying to improvise its performance. I know there are LOADS of ways to improve performance. And I familiar with most of them. This question is solely about debugging:
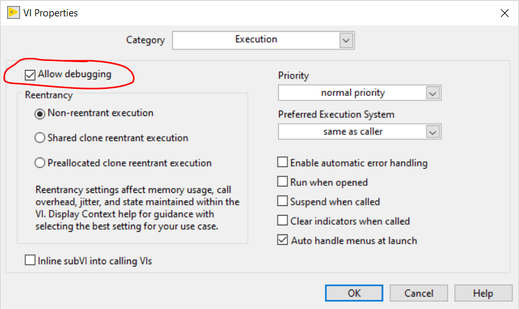
I know that in the LabVIEW development environment I can disable debugging in my VIs as seen here:
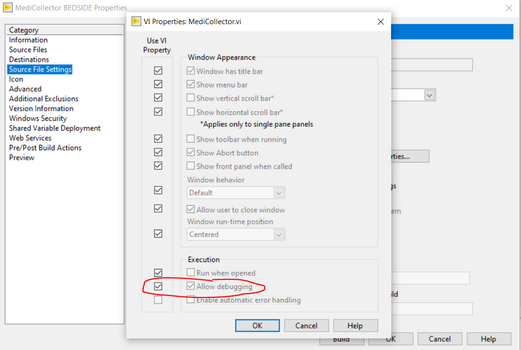
This can lower overhead and improve performance, which is sometimes useful in the development environment. But I had always assumed that debugging was automatically disabled when my VIs got built into an EXE. But I see here (below) that I can chose whether it is ON or OFF for each individual VI:
My question: Does leaving this ENABLED (as shown above) cause a performance hit? I have no intention of debuging my EXEs in the field. So should I do this to reduce overhead? And is there any downside (other than not being able to debug my EXE, of course).
I would expect that I should disable debugging for all VIs that don't have their front panel shown, correct?
Thanks for your advice!
01-07-2021 01:51 PM - edited 01-07-2021 01:51 PM
- Mark as New
- Bookmark
- Subscribe
- Mute
- Subscribe to RSS Feed
- Permalink
- Report to a Moderator
The main performance hit that I personally have noticed is that an EXE with debugging enabled can be a lot larger on disk (and therefore, in RAM) so it takes longer to load. Not noticeable for small apps but once you make apps with multiple thousands of VIs, it can be enough to make a difference.
While the exact amount is dependent on your specific files, one application I built last year was 66.2 megs on disk with debugging turned on and 33.5 megs with it off, so it was almost half the size.
Once your code is running, unless you're doing tons of math-y operations on large arrays, or running some non-scalable algorithms (big O of X squared or worse), most LabVIEW code's performance is dependent on wait times coming from hardware communication, since that's the specialty of the language. Debugging being enabled or not might save a few microseconds on a loop but if you're waiting 10 milliseconds for a response from a serial device or whatever, then those microseconds don't really matter.
01-07-2021 08:05 PM
- Mark as New
- Bookmark
- Subscribe
- Mute
- Subscribe to RSS Feed
- Permalink
- Report to a Moderator
I wouldn't worry about the "Enable Debugging" at the VI level. Just disable it at the executable level. Yes, you will see some improvements doing this. As already stated, when instrument communications come into play it likely won't matter.
There are only two ways to tell somebody thanks: Kudos and Marked Solutions
Unofficial Forum Rules and Guidelines
"Not that we are sufficient in ourselves to claim anything as coming from us, but our sufficiency is from God" - 2 Corinthians 3:5
01-08-2021 03:38 AM
- Mark as New
- Bookmark
- Subscribe
- Mute
- Subscribe to RSS Feed
- Permalink
- Report to a Moderator
It's only the Advanced -> Enable debugging that's interesting. It's off by default so all EXEs are as optimized as possible.
The setting you're looking at requires that to be enabled and then you can disable debugging on individual VIs.
01-08-2021 08:37 AM - edited 01-08-2021 08:39 AM
- Mark as New
- Bookmark
- Subscribe
- Mute
- Subscribe to RSS Feed
- Permalink
- Report to a Moderator
There are indeed really two ways you can affect the debugging. The one you show is in the VI source code and should never really be disabled. The other is in the build settings and is by default so that the VIs are build without debugging included. This mainly will affect the size of the built executable since if debugging is enabled the executable will also include the VI source code into the executable so that remote debugging is possible, and by extension the loading time of the executable will be longer as more needs to be read from disk and loaded into memory. From a pure runtime performance point of view, the difference between VIs compiled with debugging enabled and the same VI with debugging disabled is only in the single digit percentage. It is in most cases hardly measurable.

01-08-2021 10:11 AM
- Mark as New
- Bookmark
- Subscribe
- Mute
- Subscribe to RSS Feed
- Permalink
- Report to a Moderator
As a caveat I'd say there are instances when it can affect performance pretty much, as a VI with debugging can't use parallel loops those loops are affected, otherwise it's negligible.
01-08-2021 11:14 AM - edited 01-08-2021 11:15 AM
- Mark as New
- Bookmark
- Subscribe
- Mute
- Subscribe to RSS Feed
- Permalink
- Report to a Moderator
@Yamaeda wrote:
As a caveat I'd say there are instances when it can affect performance pretty much, as a VI with debugging can't use parallel loops those loops are affected, otherwise it's negligible.
Each parallel loop has it's own debugging setting and it is OFF by default, even if debugging for the VI is enabled.
Parallel loops work just fine in parallel with VI debugging enabled and parallel loops are simply skipped during execution highlighting and cannot be probed. (i.e. probes inside the parallel for loop are greyed out)
01-11-2021 09:38 AM
- Mark as New
- Bookmark
- Subscribe
- Mute
- Subscribe to RSS Feed
- Permalink
- Report to a Moderator
@altenbach wrote:
@Yamaeda wrote:Each parallel loop has it's own debugging setting and it is OFF by default, even if debugging for the VI is enabled.
Parallel loops work just fine in parallel with VI debugging enabled and parallel loops are simply skipped during execution highlighting and cannot be probed. (i.e. probes inside the parallel for loop are greyed out)
Exactly, so you can't debug parallel loops (as long as they're parallel). Actually I've never noticed the lower Debug tickbox, I've made it sequential to debug. 😄
01-11-2021 09:55 AM
- Mark as New
- Bookmark
- Subscribe
- Mute
- Subscribe to RSS Feed
- Permalink
- Report to a Moderator
@Yamaeda wrote:
Exactly, so you can't debug parallel loops (as long as they're parallel). Actually I've never noticed the lower Debug tickbox, I've made it sequential to debug. 😄
That's quite different than what you claimed earlier. 😀
You said: "as a VI with debugging can't use parallel loops" the conclusion was that the debugging enabled setting on a VI was incompatible with parallel execution.
What Christian said is that a VI with debugging enabled can very well be placed inside a parallel loop, it just won't be probable and single step highlighting is disabled inside the parallel loop. It may also have certain debugging features disabled in the actually generated compiled code as an internal feature of the LabVIEW compiler (or it may not care to do that) as they never get exercised anyways, but debugging enabled on a VI is not inherently incompatible with parallel loops. It will likely run a little slower per VI execution as the setup for some debugging hooks may still be executed but that is almost negible for VIs except when your subVI does very little in itself and is called inside the (parallel) loop many (million) times.

01-11-2021 10:26 AM
- Mark as New
- Bookmark
- Subscribe
- Mute
- Subscribe to RSS Feed
- Permalink
- Report to a Moderator
@rolfk wrote:
What Christian said is that a VI with debugging enabled can very well be placed inside a parallel loop, it just won't be probable and single step highlighting is disabled inside the parallel loop.
Actually, I did not say anything about VIs place inside parallel loops. I was only talking about code placed inside parallel loops. I would assume that a non-reentrant VI placed inside a parallel loop can be probed just fine when its diagram is open because it acts as critical section. For reentrant VIs, each parallel instance generates its own clone and that will make a difference. It is not obvious how you can probe each clone and I have not tried, but I am sure there are ways...


