- Subscribe to RSS Feed
- Mark Topic as New
- Mark Topic as Read
- Float this Topic for Current User
- Bookmark
- Subscribe
- Mute
- Printer Friendly Page
Problem getting correct graph data
Solved!04-04-2013 04:50 AM
- Mark as New
- Bookmark
- Subscribe
- Mute
- Subscribe to RSS Feed
- Permalink
- Report to a Moderator
Hello, i'm currently on an internship and I have to create an interface in LabVIEW for a Rohde & Schwarz ZVL network analyzer.
The majority of the program works like it should, only retrieving the correct graph data seems to be a problem.
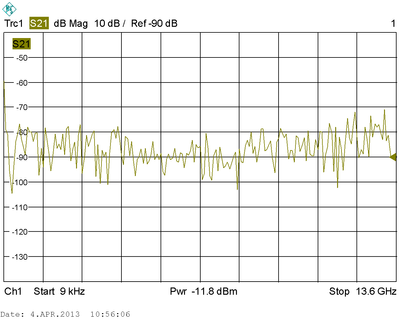
I'm getting images on my screen but the data does not correspond with the data on the device.
the device is connected to the computer using a GPIB bus, we use labview 2012 and labview 7 (the end program has to be in labview 7).
I think the problem lies with the VI that retrieves the data from the machine: (rszvl sweep)

explanation of the VI:
Here i have 2 images of the network analyzer, these images are correct and the goal is to get these on my computer in labview. (the second one is just a flat line)
Now here are a few of the creations i get in labview...
I have also attached the complete VI
Should more information be required, please ask me
thanks in advance,
Thomas V
Solved! Go to Solution.
04-04-2013 06:19 AM
- Mark as New
- Bookmark
- Subscribe
- Mute
- Subscribe to RSS Feed
- Permalink
- Report to a Moderator
Hello Thomas,
what is the version of the ZVL LabVIEW driver you are using?
Milo
04-04-2013 07:21 AM
- Mark as New
- Bookmark
- Subscribe
- Mute
- Subscribe to RSS Feed
- Permalink
- Report to a Moderator
for our 2012 labview we used the labVIEW 8.2 version found on this page http://www.rohde-schwarz.com/en/driver/zvl13/
for Labview 7 we asked for a custom version because this was no longer available at their site.
link to custom version: http://www3.rohde-schwarz.com/www/FileTranCS.nsf/alias/ZVL_LabVIEW7?OpenDocument
04-04-2013 11:19 AM
- Mark as New
- Bookmark
- Subscribe
- Mute
- Subscribe to RSS Feed
- Permalink
- Report to a Moderator
Instead of rszvl Get Trace Response Single Sweep Data.vi use rszvl Get Trace Response Data.vi with unformatted data. No math needed.
See the example if necessary.
Cheers,
Milo
04-05-2013 02:29 AM
- Mark as New
- Bookmark
- Subscribe
- Mute
- Subscribe to RSS Feed
- Permalink
- Report to a Moderator
ok thanks for the swift reply, i will try that now
04-05-2013 03:47 AM
- Mark as New
- Bookmark
- Subscribe
- Mute
- Subscribe to RSS Feed
- Permalink
- Report to a Moderator
thanks, now we figured out how to get the correct trace data on our graphs.
One more question, in 25% of the cases an query interrupted is generated in the trace response block and I have no idea where it comes from.
This causes the program to fail or false graphs to be generated.
I have already mailed to the rohde & schwarz support team, they tested my VI and the problem didn't occur there...
04-05-2013 07:34 AM
- Mark as New
- Bookmark
- Subscribe
- Mute
- Subscribe to RSS Feed
- Permalink
- Report to a Moderator
You get Query_interupted error if you send one query and during the waiting for the response you're sending another query or command. Use NI Spy to trace the occurence.
Milo
04-05-2013 08:12 AM
- Mark as New
- Bookmark
- Subscribe
- Mute
- Subscribe to RSS Feed
- Permalink
- Report to a Moderator
Thank you for the reply, I have tried to adjust some of the timeout settings to prevent this.
However it keeps occurring.
I have attached some of the spy files where the query interrupted shows up, would it be possible to have a quick look at them?
As we're having trouble interpreting the spy files.
Thanks in advance,
Thomas V.
04-08-2013 01:13 AM
- Mark as New
- Bookmark
- Subscribe
- Mute
- Subscribe to RSS Feed
- Permalink
- Report to a Moderator
Hi,
from the NI spy log file I don't see anything suspicios. Did the program stop with error at the place where log file ended?
Milo
04-08-2013 02:10 AM
- Mark as New
- Bookmark
- Subscribe
- Mute
- Subscribe to RSS Feed
- Permalink
- Report to a Moderator
No, we've programmed it that IF the program encounters an error whilst retrieving the graph data it renews it and takes a new measurement. This works most of the time, but in about 20% of the cases it generates a "false graph".


