- Subscribe to RSS Feed
- Mark Topic as New
- Mark Topic as Read
- Float this Topic for Current User
- Bookmark
- Subscribe
- Mute
- Printer Friendly Page
Possible bug in Intensity Graph while using interpolate colors on a Log scale (LV2013)
02-14-2014 02:41 PM
- Mark as New
- Bookmark
- Subscribe
- Mute
- Subscribe to RSS Feed
- Permalink
- Report to a Moderator
Hi,
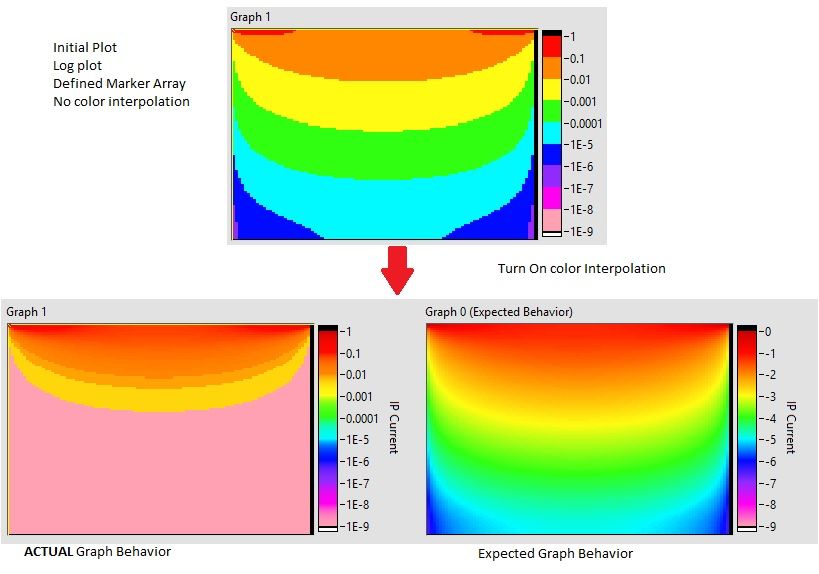
When attempting to plot data on an Intensity Graph, using a log scale (in particular in the range 1E-9 to 1), with defined color markers, and interpolate colors option 'off' the data plots exactly as expected.
However, when you turn the interpolate colors option 'on' the graph displays the correctly interpolated colors on the ramp, but NOT does not map the data to these colors correctly. It seems to map the first few layers correctly, but not the entire plot, As shown in this image. The color ramp displays the interpolated colors correctly, but the actual data is not mapped to this correctly.
After playing around with various properties of the Intensity Graph, it appears that if you switch on the interpolate colors, and then turn on the "ignore color array" property, it then shows a correct color scale (at least one that matches the now plotted data)
I cannot find any reason why this is happening and think it is a bug with the control. I've also submitted this to service request as a bug, but also wanted to submit it here to see if anyone out there had any thoughts on this...
I've found a work around of basically generating the 'log' data and color scale values before sending it to the control, and then plotting the data on a linear scale.
I have attached a small VI which shows an example of this behavior.
02-14-2014 03:19 PM
- Mark as New
- Bookmark
- Subscribe
- Mute
- Subscribe to RSS Feed
- Permalink
- Report to a Moderator
I agree that this is probably a bug. There are several other problems with standard graphs and log mapping, so this does not surprise me.
Lynn
02-14-2014 06:36 PM - edited 02-14-2014 06:37 PM
- Mark as New
- Bookmark
- Subscribe
- Mute
- Subscribe to RSS Feed
- Permalink
- Report to a Moderator
I cannot find the post, but I complained about that in very ancient forum times. When the z axis is logarithmic, the color scale needs to be linear in the log of the values. You should simply use the method on the right.
The same happens also with e.g. the scale of meters (see picture). In a better world, the scale should look the same for both!

02-17-2014 04:07 PM - edited 02-17-2014 04:10 PM
- Mark as New
- Bookmark
- Subscribe
- Mute
- Subscribe to RSS Feed
- Permalink
- Report to a Moderator
What was your service request number? I can check on the Status of that CAR for you.
FlexRIO Product Manager
02-18-2014 10:50 PM - edited 02-18-2014 10:54 PM
- Mark as New
- Bookmark
- Subscribe
- Mute
- Subscribe to RSS Feed
- Permalink
- Report to a Moderator
unfortunately, they didmt provide me with a CAR number....though they did say that they created one...
also Im not understanding the solution/work around suggested by altenbach. do you have an example of what you mean?
02-18-2014 11:08 PM
- Mark as New
- Bookmark
- Subscribe
- Mute
- Subscribe to RSS Feed
- Permalink
- Report to a Moderator
jyoung8711 wrote:also Im not understanding the solution/work around suggested by altenbach. do you have an example of what you mean?
I meant you should use your code version that works (labeled "expected graph behavior").
02-18-2014 11:12 PM
- Mark as New
- Bookmark
- Subscribe
- Mute
- Subscribe to RSS Feed
- Permalink
- Report to a Moderator
@altenbach wrote:
jyoung8711 wrote:also Im not understanding the solution/work around suggested by altenbach. do you have an example of what you mean?
I meant you should use your code version that works (labeled "expected graph behavior").
ah. gotcha! a bit inconvenient/annoying but certainly better than nothing.
thanks!
02-20-2014 05:55 PM
- Mark as New
- Bookmark
- Subscribe
- Mute
- Subscribe to RSS Feed
- Permalink
- Report to a Moderator
Hi jyoung8711,
I just sent you an email about the CAR I created, but thought I would post the CAR number here for everybody else who has similar issues. The CAR number is: 453407.
Applications Engineer
National Instruments
12-19-2024 04:34 PM
- Mark as New
- Bookmark
- Subscribe
- Mute
- Subscribe to RSS Feed
- Permalink
- Report to a Moderator
I just ran into an issue that is similar to this. This has not been fixed right? I can also reproduce this with linear plots. For example, if you change the map mode from 1 (log) to a 0 (linear) in jyoung8711's example, it still doesn't show green or blue.
12-19-2024 10:37 PM - edited 12-19-2024 10:38 PM
- Mark as New
- Bookmark
- Subscribe
- Mute
- Subscribe to RSS Feed
- Permalink
- Report to a Moderator
@nanocyte wrote:
I just ran into an issue that is similar to this. This has not been fixed right? I can also reproduce this with linear plots. For example, if you change the map mode from 1 (log) to a 0 (linear) in jyoung8711's example, it still doesn't show green or blue.
Probably it hasn't been fixed because of backwards compatibility issues. By that, I mean everyone who used a workaround would find all their controls looking funny if they ever upgraded.
(Mid-Level minion.)
My support system ensures that I don't look totally incompetent.
Proud to say that I've progressed beyond knowing just enough to be dangerous. I now know enough to know that I have no clue about anything at all.
Humble author of the CLAD Nugget.

