- Subscribe to RSS Feed
- Mark Topic as New
- Mark Topic as Read
- Float this Topic for Current User
- Bookmark
- Subscribe
- Mute
- Printer Friendly Page
Plotting Types
Solved!09-12-2017 05:36 AM
- Mark as New
- Bookmark
- Subscribe
- Mute
- Subscribe to RSS Feed
- Permalink
- Report to a Moderator
Hello everyone,
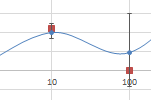
Am trying to plot graphs in the following style and type.
I need details about doing the same in LabVIEW.
Glad, if anyone helps..

You can't help everyone, but everyone can help someone ![]()
Solved! Go to Solution.
09-12-2017 05:52 AM
- Mark as New
- Bookmark
- Subscribe
- Mute
- Subscribe to RSS Feed
- Permalink
- Report to a Moderator
09-12-2017 06:34 AM
- Mark as New
- Bookmark
- Subscribe
- Mute
- Subscribe to RSS Feed
- Permalink
- Report to a Moderator
The graph on the left is tricky.
I would utilise the picture control lay over that is build in in most LV graphs. There might be a learning curve, you need to get familiar with picture controls, and graph events. Benefit is you get the graphs scaling for free.
Depending on the exact case, I might skip the graph and use only a picture control. You can do everything, but you need to do everything from 0... Drawing scales are very difficult.
09-12-2017 09:22 AM
- Mark as New
- Bookmark
- Subscribe
- Mute
- Subscribe to RSS Feed
- Permalink
- Report to a Moderator
The best way to do this in LabVIEW is use the "Advanced Plotting Toolkit" from Heliosphere. Its available free in VIPM.
https://forums.ni.com/t5/Advanced-Plotting-Toolkit/gp-p/5004
The example they provide is a scatter plot but easy enough to make it a line plot with error bars.
The underlying plotting engine is MatplotLib, so anything it can do APT can do..just about.
09-12-2017 09:36 AM
- Mark as New
- Bookmark
- Subscribe
- Mute
- Subscribe to RSS Feed
- Permalink
- Report to a Moderator
Didn't know about that toolkit. No interaction (zooming, moving, etc. like a LV graph) though.
09-12-2017 10:05 AM
- Mark as New
- Bookmark
- Subscribe
- Mute
- Subscribe to RSS Feed
- Permalink
- Report to a Moderator
True. It mainly allows you to make prettier plots and more advanced plots without any effort, but at the cost some common LabVIEW plot features.
There's documentation here - http://advancedplotting.github.io/
and examples here - http://advancedplotting.github.io/docs/index.html
09-13-2017 11:32 PM
- Mark as New
- Bookmark
- Subscribe
- Mute
- Subscribe to RSS Feed
- Permalink
- Report to a Moderator
@cstorey wrote:
The best way to do this in LabVIEW is use the "Advanced Plotting Toolkit"
The resource 'Advanced plotting toolkit' looks like a simpler and made easy tool... Thanks anyway for introducing such tool..
My opinion on these plots is that, it looks fine on the error bar or feather graph even through default library functions of NI...what matters is the auto-scaling of axis that determines the readability and more scaling processes.
Third party in this case is further adding up-to risks with complexity, and I feel like its unnecessary in this case.
09-14-2017 02:31 AM
- Mark as New
- Bookmark
- Subscribe
- Mute
- Subscribe to RSS Feed
- Permalink
- Report to a Moderator
Check out this presentation I did at NIDays and an advanced UG meeting 2011\2012. Haven't looked at is since, you'd be the first in 5 years!
It shows how to use the picture control inside graphs. You'll have the best of two worlds.
Note that the code is crap. Hardly any sub VI's, on purpose. The code is mend to demonstrate the technique, and nice code tends to hide these details. I'd go for a class, since this particular situation is very well suited for OO.
- Tags:
- graph
- picture control
09-19-2017 12:30 PM
- Mark as New
- Bookmark
- Subscribe
- Mute
- Subscribe to RSS Feed
- Permalink
- Report to a Moderator
Thanks for sharing! Interesting stuff.
09-20-2017 02:58 AM
- Mark as New
- Bookmark
- Subscribe
- Mute
- Subscribe to RSS Feed
- Permalink
- Report to a Moderator
Thanks! It seems to be an eye opener even for seasoned LV programmers. You'll never notice these overlays if you're not looking for them...


