- Subscribe to RSS Feed
- Mark Topic as New
- Mark Topic as Read
- Float this Topic for Current User
- Bookmark
- Subscribe
- Mute
- Printer Friendly Page
NatNet SDK hangs in background because of memory leak?
Solved!02-03-2023 07:24 AM
- Mark as New
- Bookmark
- Subscribe
- Mute
- Subscribe to RSS Feed
- Permalink
- Report to a Moderator
Hi!
First a heads up, I'll try to be clear, but I am not too familiar with the subject I am about to discuss, so please, bear with me 😄
Also, I can try and share some code, but I'm not sure it will help given that it requires hardware to run (and I will need to double check for my company's IP 😑)
I have a software running on a distant PC broadcasting data over the network. The broadcast is constant "into the void" and one can just connect at any time to retrieve this constant dataflow (which is the attitude of a rigid body measured by cameras)
My goal is to acquire this data and because of the specific software, I have to use the NatNet SDK 4.0. Now I have an API previously created by someone else, and it kinda-sorta runs ok. The problem is that when I stop the main application VI, Some VIs still "run" (or better their dependencies I think, see below) and I still have residual memory that I think is more than the LV environment RAM consumption.
As a behaviour description:
- When I run the VI I have a coms over the network of about 15KB/s
- When I stop the VI, the main VI window stops fully (the white runnin arrow appear) but the network usage only slowly decreases to eventually disappear (takes about 1 min)
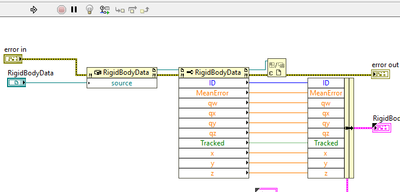
- Going into my code (when the VI is supposed to be stopped), I've realized that some Invoke Nodes and constructor nodes ( referenced to the NatNet functions, see picture below) are still running in the background.
It is not sub-vis caught in an internal loop but really one of those two nodes (that are also present in other VIs) that are somehow still doing some work. The main VI seems to stop fine and is not showing any errors nor seems to have sub-vis still running in the background.
I have made some researches already but unsuccessful. It feels to me that there are some memory leaks somewhere, but I'm not even sure what this means. Typically, in the picture above, you can see that the "RigidBodyData" reference is never closed. There is also a constructor node, but I couldn't find a destructor node (if that exists, or maybe the close reference right after is enough?)
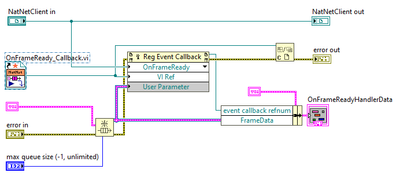
As a complementary info, this application uses a Reg Event Callback node, and all data is placed in a queue in the background. I am accessing this data simply by de-queueing it in a loop.
This VI is executed during the init process and only once.
The VI OnFrameReady_Callback.vi is the one that seems to be blocked because of background processes as shown above.
I would love to have some insights and suggestions if you have any about why these processes never stop, how to stop them properly and why the network usage decreases so slowly.
And if you feel like, without sharing some code, this is impossible to answer, I can try to come up with something.
Thanks in advance for your help.
Vinny.
Solved! Go to Solution.
02-03-2023 09:00 AM
- Mark as New
- Bookmark
- Subscribe
- Mute
- Subscribe to RSS Feed
- Permalink
- Report to a Moderator
LabVIEW callback VIs are instantiated and executed in a proxy context that is a .Net context and not a LabVIEW context. As such LabVIEW has very limited control about this proxy once it is started.
As it is, once a callback VI has been registered and instantiated it stays active and reserved until the LabVIEW process fully terminates. There is no way around that that I would know off.

02-03-2023 09:34 AM
- Mark as New
- Bookmark
- Subscribe
- Mute
- Subscribe to RSS Feed
- Permalink
- Report to a Moderator
@rolfk wrote:
LabVIEW callback VIs are instantiated and executed in a proxy context that is a .Net context and not a LabVIEW context. As such LabVIEW has very limited control about this proxy once it is started.
As it is, once a callback VI has been registered and instantiated it stays active and reserved until the LabVIEW process fully terminates. There is no way around that that I would know off.
So, after running more tests, I've realized that "OnFrameReady_Callback.vi" is released at some point. Once I've measured after 3min, and one time 5min, I'm starting to think that there might be some buffering somewhere...
What do you mean by "The labview process fully terminates"? The entire development environment/Runtime engine ?
However, when it is not yet released, it doesn't seem problematic to run the whole program again..So for now I would say that it is a sufficient solution. But I'm still very curious of what's going on in the background.
-Vinny
02-08-2023 05:35 AM
- Mark as New
- Bookmark
- Subscribe
- Mute
- Subscribe to RSS Feed
- Permalink
- Report to a Moderator
Just wanted to follow-up on that, after more research, I came across this solution to release any running background activity and blocking libraries:
This was tested in LV2015, I've just tried with LV2019 and will tr later with newer versions.


