- Subscribe to RSS Feed
- Mark Topic as New
- Mark Topic as Read
- Float this Topic for Current User
- Bookmark
- Subscribe
- Mute
- Printer Friendly Page
How to display waveform data in a Wiggle Trace or Wiggle Plot?
Solved!10-03-2012 01:18 PM
- Mark as New
- Bookmark
- Subscribe
- Mute
- Subscribe to RSS Feed
- Permalink
- Report to a Moderator
Anybody have any hints on how to do this (easily)? Basically anything above (to the right) of the axis is filled with color back to the axis.
Solved! Go to Solution.
10-04-2012 12:20 PM - edited 10-04-2012 12:21 PM
- Mark as New
- Bookmark
- Subscribe
- Mute
- Subscribe to RSS Feed
- Permalink
- Report to a Moderator
Hey Aaron,
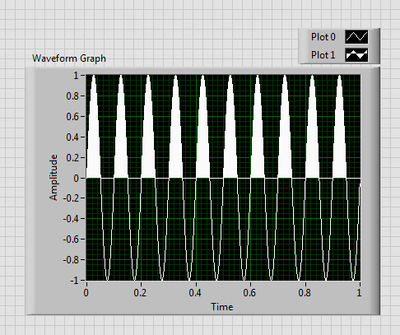
I've found a workaround for doing this, although it's not exactly an ideal solution. Basically, for each plot you could ccreate a second plot containing just the positive component of the data, and use the fill settings in the Waveform Graph to fill from the zero point to that plot. Here's the result for a simple sine wave:
And here's a VI snippet of the code I used to split out the positive component of the waveform (There may be an easier way to do this):
I hope this helps--so far, it's the only way I've found to accomplish what you're wanting. If I find anything else, I'll reply back to this post.
Thanks,
10-05-2012 11:54 AM
- Mark as New
- Bookmark
- Subscribe
- Mute
- Subscribe to RSS Feed
- Permalink
- Report to a Moderator
Daniel,
Thanks. This is similar to the solution I came up with. Neither are great, but I suppose they will get the job done.
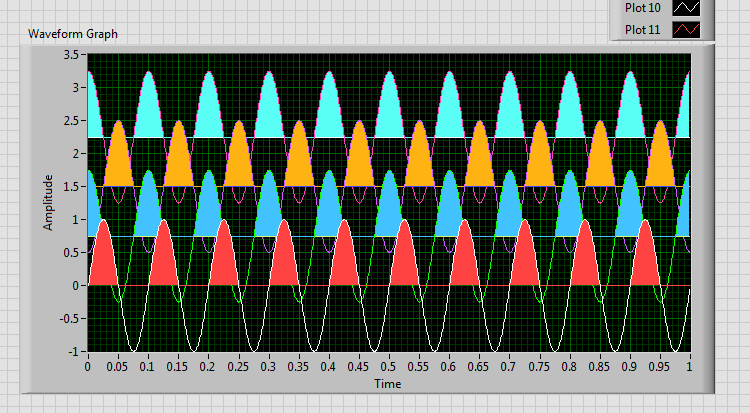
My solution: 3 layers(waveforms) for each dataset.
Layer #1 (bottom-most): Constant at offset (needed for non-zero axis).
Layer #2 (middle): Waveform. Fill to Waveform #1. Colored.
Layer #3 (top-most): Copy of waveform #2. Fill to +infinity. Same color as BG (black).
Repeat in this order for additional layers.
Your solution seems easier to implement.
Thanks.
10-05-2012 01:46 PM
- Mark as New
- Bookmark
- Subscribe
- Mute
- Subscribe to RSS Feed
- Permalink
- Report to a Moderator
Example using solution above with multiple traces.


