- Subscribe to RSS Feed
- Mark Topic as New
- Mark Topic as Read
- Float this Topic for Current User
- Bookmark
- Subscribe
- Mute
- Printer Friendly Page
- « Previous
-
- 1
- 2
- Next »
Contour Plot in Labview 7.1
06-10-2008 08:20 AM - edited 06-10-2008 08:20 AM
- Mark as New
- Bookmark
- Subscribe
- Mute
- Subscribe to RSS Feed
- Permalink
- Report to a Moderator
Beejal,
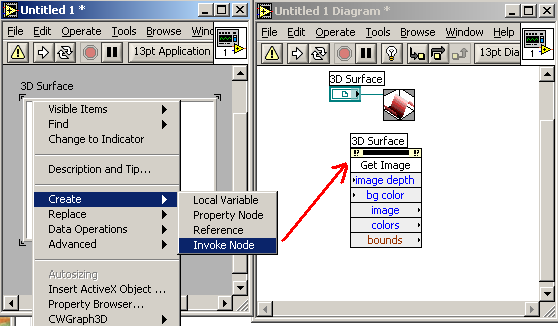
If you use an invoke node for the container you do not have to mess with the rest of the screen.
Ben
Message Edited by Ben on 06-10-2008 08:20 AM
06-10-2008 08:34 AM
- Mark as New
- Bookmark
- Subscribe
- Mute
- Subscribe to RSS Feed
- Permalink
- Report to a Moderator
Hi Ben
Thanks for that, I agree that your method is best for taking an image of a single 3D graph but I wasn't aware that you could use it if you want a 3D graph and an intensity graph on the same jpeg image. That is why I suggested taking an image of the whole VI. Do you know if you can combine the image data for both graphs?
Another option would be to create a jpeg for each graph individually and then combine them externally.
Thanks
NI UK & Ireland
06-10-2008 09:03 AM
- Mark as New
- Bookmark
- Subscribe
- Mute
- Subscribe to RSS Feed
- Permalink
- Report to a Moderator
06-10-2008 11:00 AM
- Mark as New
- Bookmark
- Subscribe
- Mute
- Subscribe to RSS Feed
- Permalink
- Report to a Moderator
Is there a way you can just save the colourmap from the intensity graph and then insert into the plot from the cwgraph? I suppose that sounds like the best solution at the moment...
Chris
06-12-2008 10:38 AM
- Mark as New
- Bookmark
- Subscribe
- Mute
- Subscribe to RSS Feed
- Permalink
- Report to a Moderator
Hi Chris
You could use the 'Get image Subset.vi' to cut out the colourmap section of the intensity graph. This is located on the Graphics & Sound pallet, under picture functions.
If you use an invoke node to get the image of the intensity graph and then pass the image data into the 'get image subset.vi'. You will need to select the area you need by specifying the coordinates of the colourmap.
I have attached an image of these functions.
Regards
NI UK & Ireland
- « Previous
-
- 1
- 2
- Next »
