- Subscribe to RSS Feed
- Mark Topic as New
- Mark Topic as Read
- Float this Topic for Current User
- Bookmark
- Subscribe
- Mute
- Printer Friendly Page
Antenna Radiation Pattern in 3D
01-23-2015 06:20 AM
- Mark as New
- Bookmark
- Subscribe
- Mute
- Subscribe to RSS Feed
- Permalink
- Report to a Moderator
Thank you Sir Johnsold..
I agree what you told and would try to implement what you have suggested..
To DCKAN,
I have already tried it wgich didn't work.
Thanks
01-23-2015 07:36 AM
- Mark as New
- Bookmark
- Subscribe
- Mute
- Subscribe to RSS Feed
- Permalink
- Report to a Moderator
See here for an old thread where the CW-3D graph was used.
And here for tags assosiated with 3D graphs.
You still have to work out the math that works for you.
Ben
01-23-2015 07:49 AM
- Mark as New
- Bookmark
- Subscribe
- Mute
- Subscribe to RSS Feed
- Permalink
- Report to a Moderator
Thanks Sir Ben,
I am looking at the tags for 3D.
02-09-2015 08:35 PM
- Mark as New
- Bookmark
- Subscribe
- Mute
- Subscribe to RSS Feed
- Permalink
- Report to a Moderator
Hi, have you solved antenna radiation pattern in 3D, if have solved , can share me something? thanks, i don't konw how to put power data from spectrum into 3D pattern.
01-03-2017 09:46 PM
- Mark as New
- Bookmark
- Subscribe
- Mute
- Subscribe to RSS Feed
- Permalink
- Report to a Moderator
can you please send me the radiation pattern plot file on my email
adityaingawale11@gmail.com
01-04-2017 04:46 AM
- Mark as New
- Bookmark
- Subscribe
- Mute
- Subscribe to RSS Feed
- Permalink
- Report to a Moderator
@dityA9762571418 wrote:
can you please send me the radiation pattern plot file on my email
adityaingawale11@gmail.com
I'm not so sure you'll get a response from anyone here, but I'm sure the spambots that roam the internet will be happy to send stuff to your email acct.
(Mid-Level minion.)
My support system ensures that I don't look totally incompetent.
Proud to say that I've progressed beyond knowing just enough to be dangerous. I now know enough to know that I have no clue about anything at all.
Humble author of the CLAD Nugget.
03-16-2017 08:58 AM - edited 03-16-2017 09:03 AM
- Mark as New
- Bookmark
- Subscribe
- Mute
- Subscribe to RSS Feed
- Permalink
- Report to a Moderator
can you provide the vi showing how you got the power received by the receiver as i'm facing problem with it.
I'm getting the required PSD but i want the power in dB and store it in spreadsheet to plot the polar plot.
09-17-2018 03:23 PM
- Mark as New
- Bookmark
- Subscribe
- Mute
- Subscribe to RSS Feed
- Permalink
- Report to a Moderator
I noticed that people are a little rude on this thread and not providing answers. Since I have work on this topic recently I decided to provide some (maybe late) answers in case anyone else needs help here.
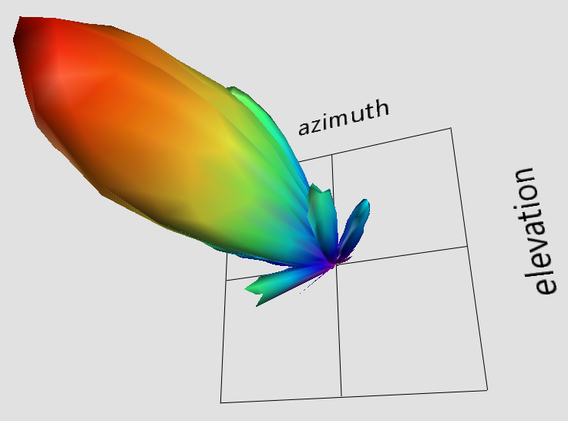
First, attached is a sample 3D data file and 3D surface plot you can use (LV2017):
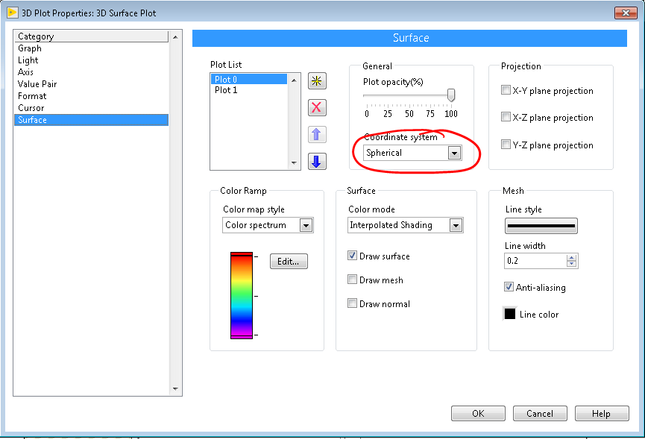
To make this happen, there is a trick to do in the plot settings (right click the plot):
Then select "sperical" coordinates:
You can immediately see the plot use the data you gave it as rho, theta and phi.
The theta and phi data are degrees converted to radians.
The rho data was actual dBm powers normalized (since rho needs positive numbers, I scaled the data from +30 dB to 0 and then I just know the data is skew some factor). I'm currently researching how to scale the legend to display this information.
Hope this guides anyone stopping here to the right place in the graph.
Regards,
Gerardo
RF SW Engineering R&D
National Instruments
10-02-2021
07:01 AM
- last edited on
10-05-2021
08:12 AM
by
![]() NI_Community_Su
NI_Community_Su
- Mark as New
- Bookmark
- Subscribe
- Mute
- Subscribe to RSS Feed
- Permalink
- Report to a Moderator
Hello,
Hope you are good. My name is Ali. I also working on the topic of Antenna Pattern Generation using LabVIEW USRP.
I would like that we connect through some social media app so that we can talk and help each other.
This will be very helpful for us. Thanks in advance for gicing your time. Looking for a reply from your side.
10-02-2021 07:24 AM
- Mark as New
- Bookmark
- Subscribe
- Mute
- Subscribe to RSS Feed
- Permalink
- Report to a Moderator
Hi Ali!
RF SW Engineering R&D
National Instruments


