LabVIEW Idea Exchange

cancel
Showing results for 
Search instead for 
Did you mean: 
Robert_Hoffman

Improvements to the Desktop Execution Trace Tool

Status: Completed
Available in Desktop Execution Trace Toolkit 2013

This is a "repost" of an idea back from 2009 - I would like to see if it will get any traction now.  

Original idea Here


I have been using the DETT pretty extensively for the last few weeks, and would love to see some simple usability improvements with a few additions for automation.

1. Better handlling of arrow up, arrow down and page up/down key strokes.  It is very jerky when scrolling through pages of a long trace

2. Addition of a search function - especially for user defined strings.  I use them as placeholders to indicate where I am in a sequence of events, and having an easy way to find them would be great.

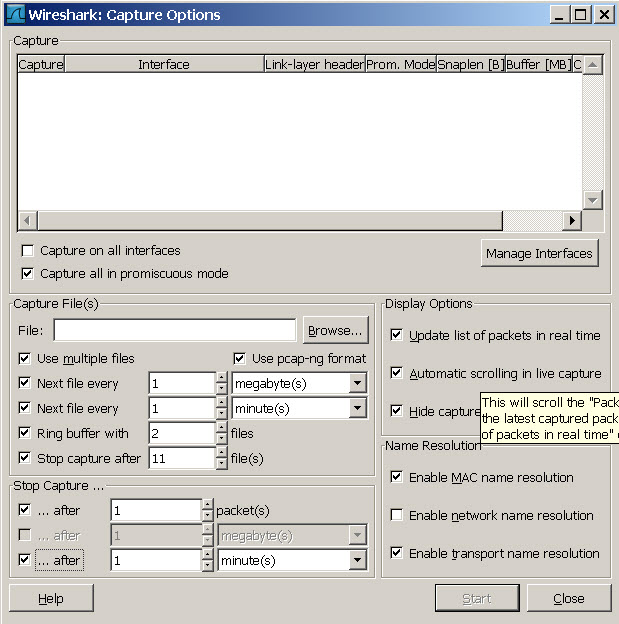
3. Rolling save of logs.  It is way to easy to run out of memory and lose a trace.  Having a way to automatically stop and save a log and start a new one would be a great way to automate data collection.  Here is a screenshot of how Wireshark does it:


Wireshark capture options


Feel free to add more thoughts, these are just a few of my major ones.


Rob

7 Comments
Active Participant

Voted b/c I use DETT a lot too, and I love Wireshark!

G-Money
NI Employee (retired)
Status changed to: In Development
 
Robert_Hoffman
Member

Awesome - since the status is "in development", does that mean some changes are coming?  I have an additional comment.  I have been tracing a tough memory leak using this, and it is next to impossible.  Watching the memory allocations helps, but you need to pair them up with memory free action.  Having a way to highlight or trace the handle on a memory block would be great.


Thanks,

Rob

Penar
NI Employee (retired)

Hi Rob,


#1, #2 is in investigation as a part of UI user experience improvements.

#3. In the future DETT most possibly let users configure dropping previous data or stop tracing as a way to prevent DETT from out of memory. The idea of providing program interface to start/stop tracing may not be available until there is a clear need for programming API as a whole.


Your problem of tracing reference leak, what DETT can possibly do is to highlight the VI with memory allocation as there is no VI object or memory block handle associated with memory allocation events. An alternative way could be online video to give an example on how to catch reference leak with DETT.

reidl
NI Employee (retired)

You're invited to the DETT 2013 beta.  There was significant work done to redesign the UI and eliminate out-of-memory issues.


Updated User Interface

  • Introduce software ribbon to replace previous toolbars and menus
  • Fix mouse-wheel bugs

Enhanced Capability to Trace Large Application 

  • Allows configuration of message limits and out of limit options to prevent out of memory issues that existed in previous DETT versions.
  • Allows log data to file when tracing
  • Enhance capture settings capability. You can now specify DETT to include/exclude VIs when capturing data.

Usability

  • Search bar(Crtl+F) allows searching all text fields in your trace
  • Navigation traces to a VI or any VIs in the call chain

New Features

  • Adds compare traces dialog. Allows you to diff between two trace sessions
  • Adds bookmark to trace line number when starting or resuming tracing
G-Money
NI Employee (retired)
Status changed to: In Beta
 
Darren
Proven Zealot
Status changed to: Completed
Available in Desktop Execution Trace Toolkit 2013