View Ideas...
Labels
-
Analysis & Computation
305 -
Development & API
2 -
Development Tools
1 -
Execution & Performance
1,027 -
Feed management
1 -
HW Connectivity
115 -
Installation & Upgrade
267 -
Networking Communications
183 -
Package creation
1 -
Package distribution
1 -
Third party integration & APIs
289 -
UI & Usability
5,456 -
VeriStand
1
Idea Statuses
- New 3,061
- Under Consideration 4
- In Development 4
- In Beta 0
- Declined 2,639
- Duplicate 711
- Completed 336
- Already Implemented 114
- Archived 0
Turn on suggestions
Auto-suggest helps you quickly narrow down your search results by suggesting possible matches as you type.
Showing results for
Options
- Subscribe to RSS Feed
- Mark as New
- Mark as Read
- Bookmark
- Subscribe
- Printer Friendly Page
- Report to a Moderator
Allow a quick "Timing Probe" for Timing Metrics
Submitted by
 JackDunaway
on
06-15-2009
07:00 PM
29 Comments (29 New)
Status:
Declined
Typical question in development process: "How quickly does my code execute? What runs faster... Code A or Code B?" So, if you're like me, you throw in a quick sequence that looks like this:
AHHH! What a mess! It's so hard to fit it in, with FP real estate so packed these days!
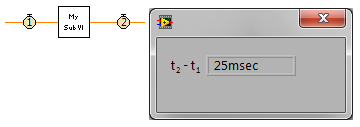
We need this:
Just like my other idea, and for simplicity's sake NI, I would be PERFECTLY happy even if you had to set up the probes during edit mode, and were not able to "probe" while running.
As a bonus, this idea may be extrapolated into n timing probes, where you can find delta t between any two of the probes.
29 Comments
You must be a registered user to add a comment. If you've already registered, sign in. Otherwise, register and sign in.


National Instruments will not be implementing this idea. LabVIEW R&D has researched the concept of a quick timing probe and concluded that, for a variety of reasons, it would be difficult to provide a robust "quick" solution. One of the primary reasons involves difficulty in determining when timestamps are gathered. Timestamps gathered at the moment of probe execution happen when upstream nodes generate the data, NOT when downstream nodes consume them. This can lead to confusion about what is being timed. For instance, if a user is trying to time a node by putting a Timing Probe on an input wire and an output wire, it is possible that the Timing Probe on the input wire executes before other inputs are ready. The resulting delta between that input wire and the output wire may be longer than the time that the node consumed.
LabVIEW R&D continues to research this issue, and we are exploring multiple alternative solutions, including:
For now, please see this forum post on Data-agnostic Smart Probes, which is a feature of LabVIEW 2016 and later that facilitates the implementation of a quick timing probe. Note that we have posted an example Timing Probe to that thread.