ni.com is currently undergoing scheduled maintenance.
Some services may be unavailable at this time. Please contact us for help or try again later.
- Document History
- Subscribe to RSS Feed
- Mark as New
- Mark as Read
- Bookmark
- Subscribe
- Printer Friendly Page
- Report to a Moderator
- Subscribe to RSS Feed
- Mark as New
- Mark as Read
- Bookmark
- Subscribe
- Printer Friendly Page
- Report to a Moderator
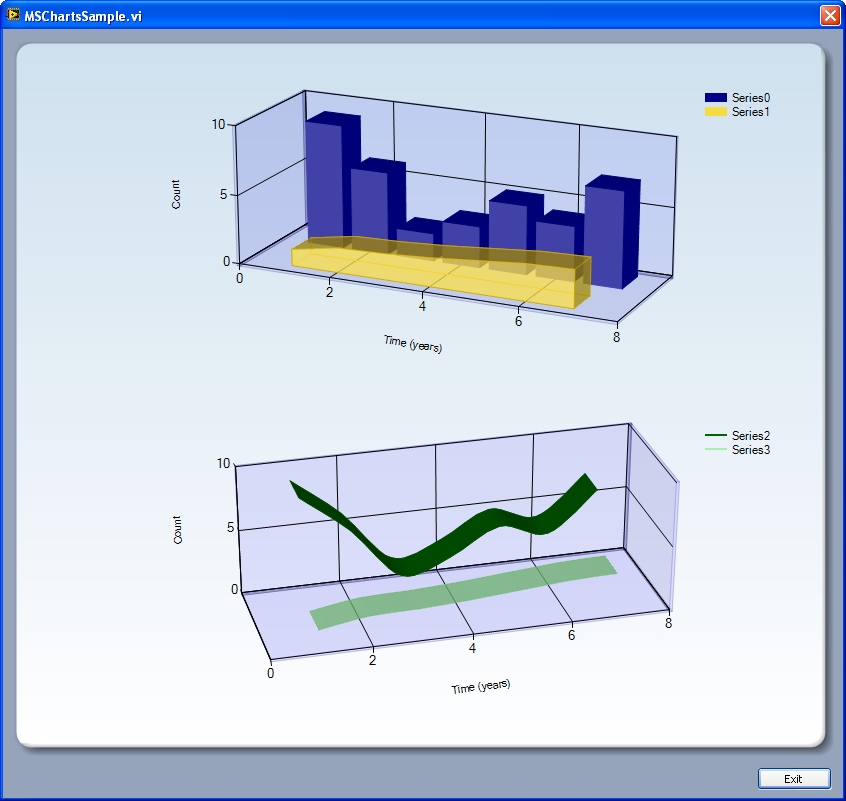
I recently came across the Microsoft Chart Controls add-on for .NET 3.5. and wondered how well they could be implemented into LabVIEW front panels. After a few hours of playing about I managed to come up with this. To run this vi, you'll need the Chart Controls add-on from Microsoft, which you can download from here for free (less than 2Mb).
The block diagram is a mess, because I was just playing with the features, but it could easily be tidied up into neat little subvi packages.
OK, so I spent a little time cleaning this up, and now there's a second download (MSChartsdemo2.zip - LV2011) which contains a neater demonstration, with easier to understand code. It's still not fully refactored, but good enough I'd say 
What do people think? I'm quite impressed with the glossy look of it all. There are plenty of different plot types to play with, just tweak the properties to your hearts content! This snapshot shows two plots in one control, same data plotted in different styles, with different colours and transparency levels.
The attached vi was created in LV 8.6.1
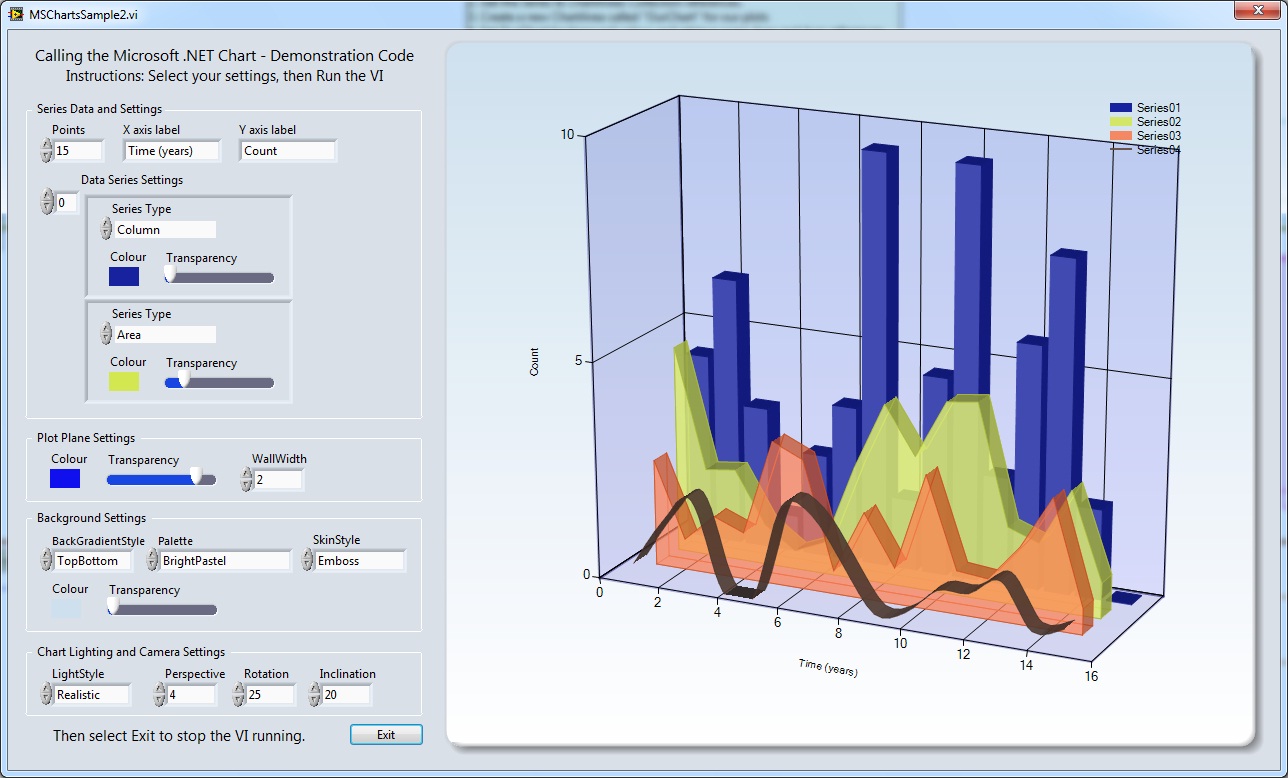
MSChartsDemo2 screenshot.
- Mark as Read
- Mark as New
- Bookmark
- Permalink
- Report to a Moderator
Nice!
The next step would be to encapsulate the .NET calls in an XControl to hide the (relative) complexity of working with the .NET API. This type of programmatic configuration is pretty common when using .NET control libraries and is not as clean as most LabVIEW users are used to. The XControl would leave you with a much easier to use LabVIEW-type terminal.
- Mark as Read
- Mark as New
- Bookmark
- Permalink
- Report to a Moderator
SimonH
Yes, embedding all the complexities into an XControl would make this much easier to interface on the Block Diagram. I've only created one or two XControls before so I'm not sure how much work that would be - I would have to make it a personal endeavour so I can't see me creating one anytime soon! 
It's also perhaps worth noting that the LabVIEW NET interface appears to be quite slow, and adding just seven X-Y points to this plot took a noticeable time. If anyone were to add a few hundred, it might become unmanageable. A few tests would be worthwhile before spending effort integrating the feature set into an XControl.
- Mark as Read
- Mark as New
- Bookmark
- Permalink
- Report to a Moderator
One technique that can be used to really speed up the drawing of .NET controls is to use whatever the controls equivalent of "Defer Updates" is - in this case there is a hide() and show() method which literally makes the control disappear, but has the upside of dramatically decreasing the rendering time. Some other .NET controls have similar methods, some of which simply freeze the control instead of hiding it.
Also, sometimes it can be worth writing a small wrapper assembly in c# to make the number crunching part of the control more LabVIEW friendly (e.g. something that could take a LabVIEW array and place the For Loop inside the .NET environment. This makes a big difference as the .NET/LabVIEW boundary is normally a choke point for any LabVIEW/.NET coding (my understanding is that its to do with the fact that the LabVIEW and .NET models are so different and therefore a lot of NI-Voodoo has to happen behind the scenes).
- Mark as Read
- Mark as New
- Bookmark
- Permalink
- Report to a Moderator
To further my last post - using the Show() and Hide() methods changes the execution time of your example VI from approximately 4950ms to 400ms on my machine!
- Mark as Read
- Mark as New
- Bookmark
- Permalink
- Report to a Moderator
Shaun,
Thanks! That's excellent advice! I shall look for the Show and Hide methods next time I include a .NET control or chart - it sounds like a lifesaver! 
- Mark as Read
- Mark as New
- Bookmark
- Permalink
- Report to a Moderator
Wrapping in an XControl really isn't too bad. I generally start the way you have and create a SubVI from it.
I've posted an example here - http://decibel.ni.com/content/docs/DOC-9982 so you can see what I mean (if you're interested and have time -- I know it's often hard to learn play with LabVIEW if you can't bill those hours)
- Mark as Read
- Mark as New
- Bookmark
- Permalink
- Report to a Moderator
Does this need the Real-Time module? It wants to load niCLK with I think is part of the NI-Scope module?
thanks
- Mark as Read
- Mark as New
- Bookmark
- Permalink
- Report to a Moderator
It certainly shouldn't need the Real-Time module. Although I can't explain what niCLK is nor why it needs it.
- Mark as Read
- Mark as New
- Bookmark
- Permalink
- Report to a Moderator
OK Simon, I've done it! 
One XControl: http://decibel.ni.com/content/docs/DOC-12073
- Mark as Read
- Mark as New
- Bookmark
- Permalink
- Report to a Moderator
These look great. It would be nice if NI made some of the more pertinent charts natively available in LabVIEW (fastest developer programming and faster processor execution).
- Mark as Read
- Mark as New
- Bookmark
- Permalink
- Report to a Moderator
Nice
But i have one problem, some site want multiple y-axis in ms-chart control.
Now i m in trouble, Please send me solution of that problem.
Thanks in Advance
- Mark as Read
- Mark as New
- Bookmark
- Permalink
- Report to a Moderator
good~
