- Document History
- Subscribe to RSS Feed
- Mark as New
- Mark as Read
- Bookmark
- Subscribe
- Printer Friendly Page
- Report to a Moderator
- Subscribe to RSS Feed
- Mark as New
- Mark as Read
- Bookmark
- Subscribe
- Printer Friendly Page
- Report to a Moderator
Solar Cell Efficiency Assessment System
Author(s):
Pong Ke Xin, Student
Leong Jun How, Student
Rodney Tan, Senior Lecturer
Academic Institution:
Faculty of Engineering, Architecture and Built Environment
UCSI University, Malaysia
Products Used
WLS-9163
NI cRIO-9215
NI LabVIEW 8.5
The Challenge:
In the 21st century, there is very rapid growth in the rate of photovoltaic applications. The efficiency of solar energy compared to electric energy, which is relatively inexpensive, and other types of energy resources remains questionable from consumers’ point of views. Therefore, mono-crystalline and poly-crystalline solar cells have been used for performance testing in order to help enhance consumer confidence.
The Solution:
Both LabVIEW 8.5 and WLS 9163 were used to develop the system, Solar Cell Efficiency Assessment System. WLS 9163 was used to acquire the voltage reading absorbed by the mono-crystalline and the poly-crystalline solar cell, the temperature reading detected by the LM35 and the voltage reading of the photodiode as well. The LabVIEW 8.5 was then used to display the voltage changes of the solar cells acquired, in order to evaluate their efficiency.
Abstract
The development of Solar Cell Efficiency Assessment System is to provide a low cost system to evaluate the efficiency of the solar cells, which is made of different material and thus have different temperatures and rating conditions. Normally, consumer who uses solar cell would want to go through the efficiency assessment process of the solar cell. This assessment can now be done by using the system developed using National Instrument products. The system ultimate aim is to allow a fair comparison of solar cells of different PV technologies, in order to meet consumer expectations and improve consumer confidence for wider utilization of PV technology. Finally, by using WLS-9163, the voltage reading is obtained from both the solar cells and temperature sensor which was placed under the sun light and through the LabVIEW 8.5, the waveform chart has been plotted. The numerical value of the voltage reading is also shown in the graphic user interface (GUI) created using LabVIEW 8.5.
Introduction
With the rapid growth rate in PV applications, the need for an effective solar cell testing is very important to provide consumer with a high level assurance. Recently, government keeps emphasizing about advocating green energy. Therefore, using electricity generated by solar cells is one of the good actions showing support to green energy. In fact, electricity generated using solar cell does not produce pollution nor noise during operation, no fuels of any kind of materials are consumed during the production of the electricity, and no flooding or other forms of environmental disturbance. Besides, without any mechanical moving parts, PV solar cells require very little maintenance. However, consumer faced several problems when using solar cells because solar cells are expensive to manufacture and they produce relatively small amount of electricity per day, and therefore there are restrictions on what can be powered by them.
According to a study, the maximum efficiency of solar cell is 30% while the maximum efficiency of burning sources is 40%. There is only 10% different in efficiency. In other word, with only 10% less efficiency, which is acceptable, a clean energy without any pollution can be generated using solar cells. In fact, the efficiency of solar cells ranges from between about 10% and 20%, which is depending on the type of cell. Mono-crystalline PV cell is the most efficient cell which ranges from 15% to 20% and its maximum recorded efficiency is 25%. It is also the most expensive cell and more difficult to manufacture. On the other hand, poly-crystalline PV cell is cheaper but it is slightly less efficient. Its efficiency range is from 13% to 16% and its maximum recorded efficiency is 20.3%.
Therefore, by applying the solar cell in industries, normally consumer will prefer the solar cell which has higher efficiency. For instance, if consumer uses the solar cell without doing any solar cell efficiency assessment, he might be or might not be using the most appropriate solar cell. If he uses the less efficient solar cell, a large area is required for the solar cell installation in order to produce the desired output. Inversely, if he uses the high efficient solar cell, the area for solar cell installation can be reduced to produce the same output. Hence, knowing the solar cell efficiency is very important in order to save the area consumption and cost as well.
System Overview
The complete system overview block diagram is as shown in Figure 1. The Solar Cell Efficiency Assessment System is made up of two different parts. The first part is formed by four different inputs which are LM 35 (temperature sensor), mono-crystalline PV cell, poly-crystalline PV cell, and photodiode. The second part is a computer with preinstalled LabVIEW 8.5, and WLS-9163. These two parts are integrated together to function as a complete system.
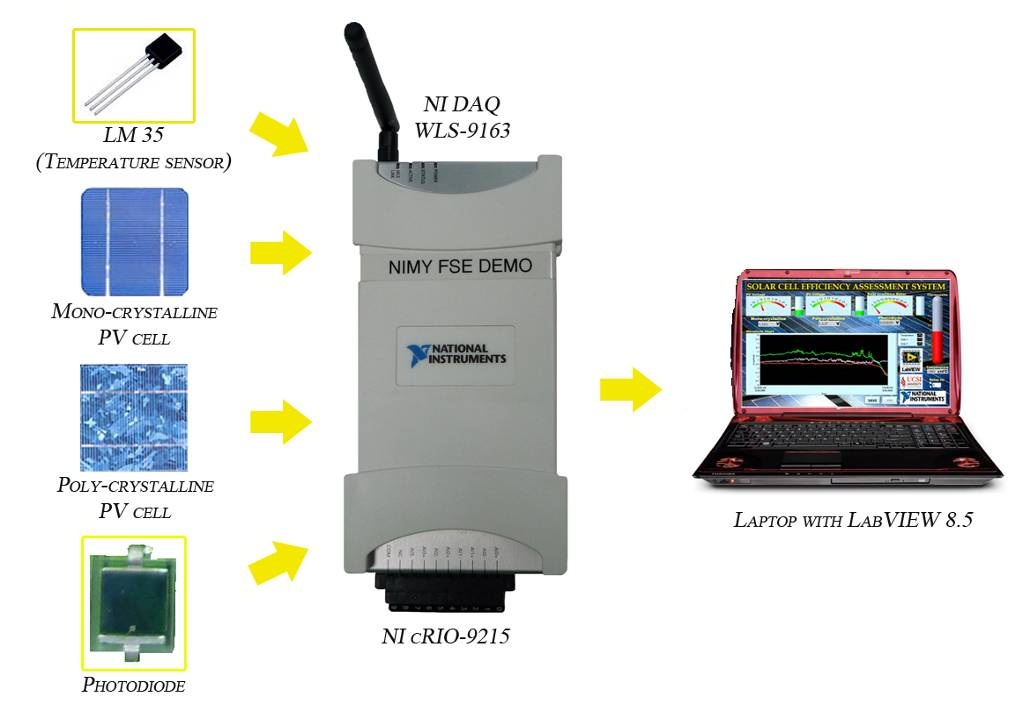
Figure 1 Block Diagram of System Overview
In the system, both of the solar cells are placed under the sun light to absorb light, which is converted to electrical energy. For the LM 35, it functions as a temperature sensor. A temperature sensor is required because temperature determines the changes of solar irradiance reading obtained from the photodiode. Photodiode is used to measures the radiant intensity of sunlight and is useful in the performance of a solar panel. The photodiode produces a photocurrent of 3.337±0.116 mA at an ambient temperature of 25 °C when exposed to a solar irradiant of 1000 W/ . With this irradiance, the voltage across the resistor will be 0.1 V.
Table 1
Solar Irradiance Meter
Temperature Correction Factors
Temp (°C) | Correction Factor |
-40 | 1.0695 |
-30 | 1.0582 |
-20 | 1.0471 |
-10 | 1.0363 |
0 | 1.0256 |
10 | 1.0152 |
20 | 1.0050 |
25 | 1.0000 |
30 | 0.9950 |
40 | 0.9852 |
50 | 0.9756 |
60 | 0.9662 |
Irradiance = Reading x Correction Factor
According to the study, the photodiode will change within the temperature ranges of -40 °C to 60 °C. The current produced by the photodiode will change with temperature at a rate of 0.1% per degree. Thus, the reading can be multiplied by the appropriate correction factor listed in the table above.
For industries, exact voltage value and solar irradiance reading are important for evaluation of the solar cell efficiency. The Solar Cell Efficiency Assessment System is applied through the LabVIEW 8.5 because there are a waveform chart and a numerical value to specify the exact voltage value absorbed by the solar cells.
Results and Discussion
The GUI is created using LabVIEW 8.5 as shown in Figure 2. The PV voltage is to show the voltage absorbed by the solar cell which varied with the light intensity. The solar irradiance reading is to show the photodiode reading which will change with temperature at a rate of 0.1% per degree. The thermometer is to show the temperature acquired. Delay is to determine the delay time interval between the current sample and the next sample for data plotting. The save button is functions as a screen capture to save the particular waveform while the system is still running. The waveform chart allows users to compare the PV voltage absorbed by the different solar cells which are placed under the same physical conditions with the same temperature to evaluate the efficiency of the solar cell.

Figure 2 Graphical User Interface of Solar Cell Efficiency Assessment System
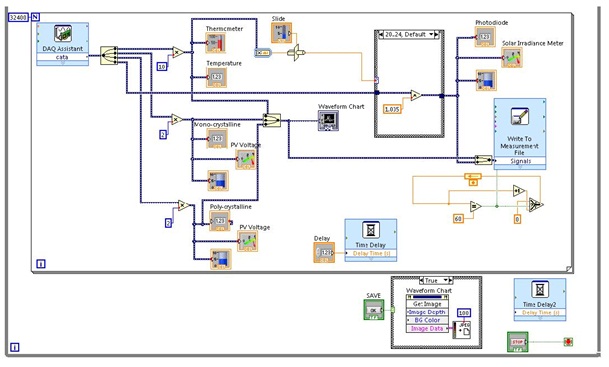
Figure 3 Block Diagram of Solar Cell Efficiency Assessment System
The complete setup of the experiment is shown in Figure 3. During the assessment, the WLS-9163 has been used. By using WLS-9163, the system can be placed under the sunlight to obtain the PV voltage, temperature reading and the solar irradiant reading while the data can be collected indoor by a computer with preinstalled LabVIEW 8.5. The waveform chart shows three lines with different color. The white line is to indicate the temperature reading, the red line is to indicate the PV voltage of the Mono-crystalline PV cell, and the green line is to indicate the PV voltage of the Poly-crystalline PV cell and all the inputs are connected to the WLS-9163. From the waveform chart, three different points are used to evaluate the efficiency of the solar cells. During the day time, when the temperature detected is 27 ˚C, the PV voltage of the mono-crystalline PV cell is 2.61 V, while the PV voltage of the poly-crystalline PV cell is 3.57 V. During the afternoon, when the temperature detected is 31 ˚C, the PV voltage of the mono-crystalline PV cell is 2.72 V, while the PV voltage of the poly-crystalline PV cell is 4.22 V. During the evening, when the temperature detected is 28 ˚C, the PV voltage of the mono-crystalline PV cell is 1.37 V, while the PV voltage of the poly-crystalline PV cell is 1.18 V.
From the data, it shows that the mono-crystalline PV cell is more efficient than the poly-crystalline PV cell. It is because when the sun light intensity is strong, the PV voltage absorbed by the mono-crystalline PV cell only increased by 0.11 V while for the poly-crystalline PV cell, it is increased by 0.45 V. For the data collected in the evening, although the temperature detected is 28 ˚C but the sun light intensity is reduced. Therefore, the PV voltage of the mono-crystalline PV cell is decreased until 1.37 V, similarly for the poly-crystalline PV cell, it is decreased as well which is 1.18V. In other word, the efficiency of mono-crystalline PV cell to absorb the light is more stable with vary light intensity. However, for the poly-crystalline PV cell, it shows great changes with varying light intensity. Therefore, mono-crystalline PV cell is more suitable to produce a constant output for the industry.
As from Table 1, although the temperature range for the photodiode is from -40 °C to 60 °C, but only the highlighted values, 20 °C to 50 °C are applicable in the system. It is because Malaysia is known as a tropical country and the most notable feature is that it has no obvious change in the temperature throughout the year. As mentioned above, photodiode reading will change with temperature. Therefore, in order to obtain the correct solar irradiance reading, the appropriate correction factor is used.

Figure 4 Experiment Setup of Solar Cell Efficiency Assessment System
Conclusion:
By using LabVIEW 8.5 and WLS-9163, the Solar Cell Efficiency Assessment System has been successfully developed. With the system, it provides a low cost system to evaluate the efficiency of the solar cells. Therefore, the system can meet consumer expectations and improve consumer confidence for wider utilization of PV technology.
For more information, contact:
Rodney Tan
Senior Lecturer
UCSI University, Malaysia
No:1, Jalan Menara Gading, UCSI Heights, 56000 Kuala Lumpur Malaysia
Tel: +6017-3078955
Fax: +603-91023606
Email: rodneyt@ucsi.edu.my
