- Document History
- Subscribe to RSS Feed
- Mark as New
- Mark as Read
- Bookmark
- Subscribe
- Printer Friendly Page
- Report to a Moderator
- Subscribe to RSS Feed
- Mark as New
- Mark as Read
- Bookmark
- Subscribe
- Printer Friendly Page
- Report to a Moderator
Contact Information
University: University of Oklahoma
Team Member(s): Jacob Henderson, David Sandmann
Faculty Advisors: Dr. John Fagan
Email Address: jhenderson@ou.edu
Country: USA
Project Information
Title: Data Acquisition and Telemetry System for Application on Electric Racing Go-Kart, USA
Description:
This project used National Instruments (NI) hardware and software to implement a system capable of collecting data from batteries, current sensors, temperature sensors, and position sensors located on an electric racing vehicle. Additionally, the project implemented a telemetry system capable of real time processing, analysis, and storage of data collected from the vehicle.
Products:
NI cRIO-9075
NI 9206 Module
NI 9853 Module
NI 9263 Module
NI 9211 Module
LabView
LabView FPGA Module
The Challenge:
The Sooner Electric Racing (SER) team from the University of Oklahoma entered the 2012 EV Grand Prix challenge hosted by Purdue University at the Indy Motorspeedway in Indianapolis, Indiana. The challenge required each team to design, construct, and race an all-electric go-kart vehicle with constraints placed on vehicle size, vehicle weight, motor size, battery capacity, and power consumption. The race format required the electric vehicle to complete 100 laps around a quarter mile course without exceeding these specific limits. It became evident early in the engineering process that a data acquisition and telemetry system would be a key component of a competitive vehicle in all three areas of the challenge: design, construction, and racing.
In the world of racing, technology develops rapidly in an effort to obtain a competitive edge. The technology advancements from racing often find their way into mass production vehicles. From titanium connecting rods, to anti-lock brakes, and even the humble rear view mirror, a significant amount of technology used in today’s vehicles originated from the intent to create a more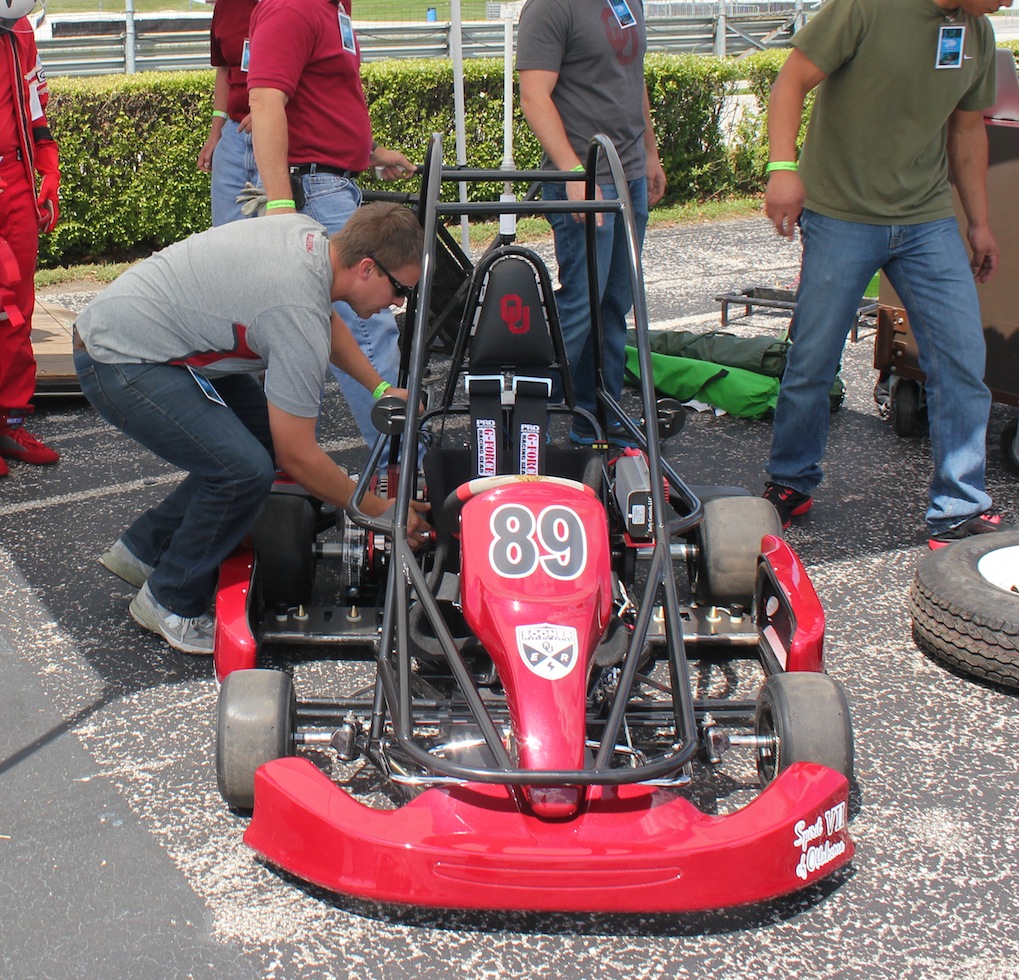 competitive racing vehicle.
In 1911 at the inaugural Indianapolis 500, Ray Harroun, an engineer from the Marmon Motor Car Company, entered into the race an innovative vehicle with an engine that was able to be competitive and at the same time was reliable and stable enough that it would not destroy itself during the race. Until this time, the powerful engines used in racecars required a mechanic to be in the vehicle to maintain the engine during the race. These mechanics also served another important role: because the speed of the cars prevented the driver from being able to look behind them, the mechanics were used to also keep a lookout behind the vehicle for other cars approaching. Without the need for the mechanic on board and the subsequent reduction in weight, Ray Harroun drastically increased the performance of his car. The other teams at the 1911 Indianapolis 500 objected to the lack of a mechanic on board but could only offer the inability of the driver to see behind him as a valid objection. They argued this was unsafe and without someone riding shotgun, the driver would not be able to know when someone was approaching from behind. Ray Harroun proceeded to design and manufacture a center rear view mirror that he placed in the car, which allowed him to keep an eye on the track behind him [1]. Harroun went on to win the 1911 Indianapolis 500 [2].
Race challenges, including the 2012 EV Grand Prix challenge, are hosted to foster these advances and developments. In this instance, the Sooner Electric Racing team developed, with the use of NI hardware and software, technology to improve efficiency in design, construction, and speed.
The Solution:
For this challenge, the Sooner Electric Racing team identified three challenges for which efforts in engineering would prove beneficial: create the ability to monitor the vehicle and drive system performance in real-time on a remote device; maximize the efficiency of the vehicle vis-à-vis design and construction; and train a driver to optimize the efficiency of the vehicle in its operation. Because having the most efficient vehicle is not enough by itself to win a speed-based competition, we concluded the first and third challenge areas would provide the most beneficial advances in comparison to other competitors. Our reasoning was based upon the premise that if the vehicle is operated in a poor and inefficient manner, then the work put into making the car efficient is never realized. In order to produce the most competitive race vehicle possible, the team decided to implement an innovative data acquisition and telemetry system. The data acquisition and telemetry system implemented by the Sooner Electric Racing team provides simultaneous monitoring, analysis, and data storage of our vehicle’s systems and performance. With the use of a data acquisition and telemetry system, we were able to apply engineering practices that helped to improve both the vehicle performance and driver efficiency.
National Instruments hardware and LabView software was used to implement the data acquisition and telemetry system for our project. NI products were chosen as tools for this project because they provided an entire package capable of filling the needs required for the data acquisition and telemetry system. The hardware and software is so well integrated that it made development of the data acquisition and telemetry system straightforward. That allowed our team to focus on the engineering aspects and use the data to enhance our vehicle’s and driver’s abilities.
The block diagram below shows the architecture of our system.

Figure 1 - System Block Diagram
As shown in the diagram above, vehicle data is acquired from two different sources: the batteries and sensors. The batteries used on the vehicle communicate with a battery management system (“BMS”), which is also located on the vehicle, for the purposes of sending important usage and error information. The BMS relays the information through a CAN interface to a cRIO that is also integrated into the vehicle. The cRIO also gathers information from sensors monitoring pack voltage, pack currents, throttle position, brake position, and motor temperature.
The data acquired by the cRIO from the onboard batteries and sensors is then broadcast via an 802.11 wireless link to a computer located in the pit area for processing, display, and storage.
The data received by the computer from the cRIO located on the vehicle is processed using LabView. LabView code was developed to read CAN data frames, parse CAN data, read analog sensor data, scale sensor data, display processed data, and store all data to file. Figure 2 and Figure 3 below show the LabView front panels developed and used as part of this project.

Figure 2 - Main LabView Front Panel
The front panel shown in Figure 2 is the main display. This display contains the vital information acquired and produced by the software. Within this display, battery energy information such as voltage, current, state of charge, and power, is shown at the bottom. Additionally, temperature information and fault conditions are displayed in the top right corner. Centered at the top, there is a display showing information for each lap the vehicle has completed. The information tracked for each lap is the number, lap time, power used, regenerated power, and total power. Each lap is manually tracked by the user when the “Lap” button is pressed.

Figure 3 - LabView Front Panel Displaying Battery Information from CAN Interface
The front panel shown in Figure 3 displays the information received via the CAN interface from the battery management system (BMS). It is used to monitor battery system health. The vehicle has eight batteries on board and the BMS sends state of charge, voltage, current, temperature, and individual cell voltages for each battery. In addition, the BMS also sends other information such as status and fault conditions.
As an added feature to the system, LabView code was also developed to broadcast information to an iPad. This feature was accomplished by using TCP/IP communication features of LabView to broadcast critical information to an application running on an iPad. This feature was implemented to ensure that the crew chief would have access to vehicle information during the race in the event that the computer used to receive the data from the vehicle could not be located in the pit area. The figure below shows a screenshot of the iPad application.

Figure 4 - Image of iPad Application
For driver training purposes, a GPS data acquisition system was also used during test and practice. An Ashtec Zxtreme GPS receiver located on the vehicle was used to record vehicle position data during practices. The GPS position data is then post processed using differential processing techniques capable of producing centimeter position accuracy. The precision GPS data is then overlaid onto a map of the practice track and correlated with gathered vehicle performance data. The map overlay is used to visually show drivers their paths around a track. The correlation data is used to measure a driver’s performance of energy usage. Figure 5, below, shows an image of the GPS data overlaid onto the practice track.

Figure 5 - Image of Practice Track with GPS Data
Using images like the ones shown in Figure 5 made it possible to work with and train drivers on techniques and paths to take in order to increase efficiency and reduce lap times. In addition to using GPS data to track vehicle paths, data monitored from the vehicle was correlated to the GPS position data.

Figure 6 - Image of GPS Data Correlated to Vehicle Data
The image in Figure 6 shows the GPS data correlated to vehicle power, temperature, and speed data. This data was also used in training drivers to be more efficient while driving the vehicle around the course. This data allowed for identifying areas of high-energy use and inefficient driving patterns.
Using National Instruments hardware and software systems, the Sooner Electric Racing team was able to develop technologies and processes for the purpose of optimizing efficiency of an electric go-kart. Specifically, the technology was used to monitor and maximize vehicle and driver efficiency during both test and race stages.
- Tom Currie, 10 Things in Your Car That Were Developed from Racing Technology, Mandatory (June 7, 2012, 1:00 PM), http://www.mandatory.com/2012/06/05/10-things-in-your-car-that-were-developed-from-racing-technology....
- Popely, Rick; Riggs, L. Spencer (1998). "1911". Indianapolis 500 Chronicle (Publications International, Ltd.): p. 10.
