- Document History
- Subscribe to RSS Feed
- Mark as New
- Mark as Read
- Bookmark
- Subscribe
- Printer Friendly Page
- Report to a Moderator
- Subscribe to RSS Feed
- Mark as New
- Mark as Read
- Bookmark
- Subscribe
- Printer Friendly Page
- Report to a Moderator
LabVIEW Machine Learning Toolkit
Options
The LabVIEW Machine Learning Toolkit is no longer supported. National Instruments has released the LabVIEW Analytics and Machine Learning Toolkit which is formally supported and maintained by National Instruments R&D.
1. Introduction
The idea of machine learning is to mimic the learning process of human beings, i.e., gaining knowledge through experience. Machine learning algorithms allow machines to generalize rules from empirical data, and, based on the learned rules, make predictions for future data. The Machine Learning Toolkit (MLT) provides various machine learning algorithms in LabVIEW. It is a powerful tool for problems such as visualization of high-dimensional data, pattern recognition, function regression and cluster identification.
2. Features
The Machine Learning Toolkit includes the following features.
2.1 Unsupervised Learning Algorithms
Unsupervised learning refers to the problems of revealing hidden structure in unlabeled data. Since the data are unlabeled, there is no error signal fed back to the learner in the algorithm. This distinguishes unsupervised learning from supervised learning.
Clustering is one of the main and important approaches of unsupervised learning. Clustering means the assignment of class memberships to a set of objects so that similar objects are assigned into the same class and dissimilar ones are assigned into different classes. Each class often represents a meaningful pattern in the respective problem. Clustering is thereby useful for identification of different patterns in data. For example, in image processing, clustering can be used to divide a digital image into distinct regions for border detection or object recognition.
List of functions:
- k-means
- k-medians
- k-medoids
- Fuzzy C-means
- Gaussian Mixture Model (GMM)
- Hierarchical Clustering
- Spectral Clustering
- Vector Quantization (VQ)
- Self-Organizing Map (SOM)
2.2 Supervised Learning Algorithms
Supervised learning refers to the generalization of the relationship (function) between the input data and their corresponding outputs (labels). The relationship (function) is learned through a training set of examples, each of which is a pair of an input data and a desired output. During the training, the error between the actual and the desired outputs is frequently fed back into the system for tuning the system parameters according to certain learning rule. After the training, the performance of the learned relationship (function) should be evaluated on a test set (of examples) that is separate from the training set.
Supervised learning is useful for pattern recognition, function regression, etc. One example of applications is recognition of handwriting numbers. A supervised classifier can be trained with a reservoir of handwriting numbers, each with a label (the true numbers it represents). Having been validated on a separate test set, the trained classifier can be used for fast and accurate recognition of future handwriting numbers.
List of functions:
- k-Nearest Neighbors (k-NN)
- Back-propagation (BP) Neural Network
- Learning Vector Quantization (LVQ)
- Support Vector Machine (SVM)
2.3 Dimension Reduction Algorithms
Dimension reduction refers to the process of reducing the number of dimension of the data. The projection of the data set in the reduced space is often desired to preserve certain important data characteristics. In some cases, data analysis, such as clustering, can be done more easily and accurately in the reduced space than in the original space. One prime application of dimension reduction is face recognition, where face images represented by a large number of pixels are projected to a more manageable low-dimensional feature space before classification.
List of functions:
- Isometric Feature Mapping (Isomap)
- Locally Linear Embedding (LLE)
- Multidimensional Scaling (MDS)
- Principal Component Analysis (PCA)
- Kernel PCA
- Linear Discriminant Analysis (LDA)
2.4 Validation & Visualization Utilities
The MLT provides validation and visualization utilities to facilitate the monitoring of the quality of learning. The utilities fall into three categories: cluster validity indices, evaluation of classification, visualization of learned results. The list of functions in each category is shown below.
- Cluster validity indices:
- Evaluation of classification:
- Visualization of learned results:
- Visualization (2D &3D)
- Plot SOM (2D &3D)
3. System Requirements
- Windows XP or later
- LabVIEW 2009 or later
4. Installation Notes
- Download and unzip the latest installer from NI Labs. Run Setup.exe.
- Restart LabVIEW if it was running during the installation process.
- Open the diagram and go to Addons >> Machine Learning.
- Mark as Read
- Mark as New
- Bookmark
- Permalink
- Report to a Moderator
Looks like these tools will compliment the Prognostics Toolkit for LabVIEW, www.ni.com/watchdogagent
Solutions Manager, Industrial IoT: Condition Monitoring and Predictive Analytics
cbt
512 431 2371
preston.johnson@cbtechinc
- Mark as Read
- Mark as New
- Bookmark
- Permalink
- Report to a Moderator
Hey guys, this is a pretty cool toolkit. It seems really well suited to Big Physics type applications and based on our conversations today can be used for prognostics as well which would typically be used in OEM type applications. Both of these applications typically use linux boxes for their deployments and I was wondering about the feasibility of porting the MLT over to linux. Thanks.
Solutions Marketing - Automotive
National Instruments
National Instruments Automotive Solutions
- Mark as Read
- Mark as New
- Bookmark
- Permalink
- Report to a Moderator
Thanks. Linux should not be a problem, as the toolkit is VI based. At some point (usually the linear algebra level) we call into the Advanced Analysis Library, which is a shared library in Linux, but that is not a limiting factor. We have no external dependencies. That being said we have not specifically tested on the Linux platform either.
- Mark as Read
- Mark as New
- Bookmark
- Permalink
- Report to a Moderator
I'm having some trouble installing the toolkit. When I launch the installer it says "You must install LabVIEW 2009 or later on the system before you can run this setup."
I currently have Labview 2011 (64 bit) installed.
Any ideas what my issue may be?
- Mark as Read
- Mark as New
- Bookmark
- Permalink
- Report to a Moderator
I just upload another installer for 64-bit LabVIEW. Please download and install the new one, Machine Learning Toolkit Installer (64-bit).zip. Thanks.
- Mark as Read
- Mark as New
- Bookmark
- Permalink
- Report to a Moderator
Just tried it. I'm still having the same issue.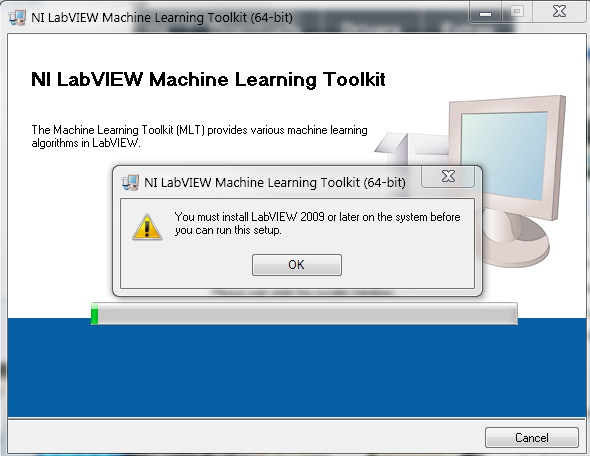
I appreciate the prompt effort none the less.
- Mark as Read
- Mark as New
- Bookmark
- Permalink
- Report to a Moderator
I do not know the reason without accessing your machine. However, I think you could install the toolkit manually. Please download the new zip file attached, unzip it and copy 'Machine Learning' folder to <LabVIEW>\vi.lib\addons.
- Mark as Read
- Mark as New
- Bookmark
- Permalink
- Report to a Moderator
It certainly could be me, but I've now tried the installer (setup.exe) on two computers (the same one as before and another 64 bit machine running LV 2010 64 bit). I got the same error in both cases.
I believe I was, however, able to get it to install by running the install.msi file in the 'dp' folder instead of running setup.exe in the main folder.
Again, thanks for the help and I look forward to trying out the toolkit.
- Mark as Read
- Mark as New
- Bookmark
- Permalink
- Report to a Moderator
Thanks for your sharing. It is very useful!
- Mark as Read
- Mark as New
- Bookmark
- Permalink
- Report to a Moderator
Great toolkit. It brings to LabVIEW many functions for which I would usually use MATLAB.
Keep up the good work!
jki.net
vipm.io
- Mark as Read
- Mark as New
- Bookmark
- Permalink
- Report to a Moderator
I am a past long time LV user (v2.1 through v8.5). I am taking a Stanford online machine learning class via coursera.org in which we use a text based language Octave (or Matlab if you have it, I don't). This is a really painful way to program and do program trouble shooting. Since the early part of the course involves not just the fundemental principles but also making code snips for implementing the algorithms that are already provided in the toolkit, it probably wouldn't help much for me right now. BUT, boy do I miss the ease of looking at the data as it is processed without having to add a bunch of prints or typing commands into the programming console window!!!! Makes me again appreciate the ease of development in LV.
- Mark as Read
- Mark as New
- Bookmark
- Permalink
- Report to a Moderator
Hi,
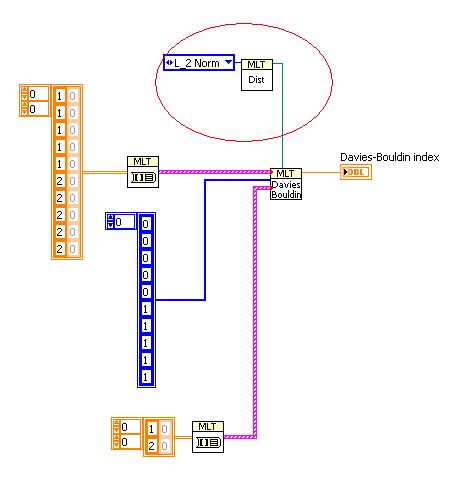
I'm trying to use the Davies-Bouldin and Dunn vi's to give me a value of clustering. When I run these vi's I get an error code (1026). I tried to create a very simple example (just a 10 element cluster with 5 having a value of '1' and the other '2', with a class labels of 5 x '0' and 5 x '1') and this still gave me the error. Can anyone help, advise or have a working example for this?
Thanks.
- Mark as Read
- Mark as New
- Bookmark
- Permalink
- Report to a Moderator
Hi,
Error 1026 is caused by invalid VI reference. To use Davies-Bouldin and Dunn vi, you have to specify the vi to compute the 'distance' between two samples. You can use the Default Distance.vi in Utilities pallette, or create your own distance vi based on your data structure.
I do not know how to attach vi here. So I just attach the screen shot of the diagram.
- Mark as Read
- Mark as New
- Bookmark
- Permalink
- Report to a Moderator
Hi there,
I'm taking the same course right now, of course with an eye on applying what I've learned to LabVIEW. You surely are right about the advantage of LabVIEW allowing us to 'look' at the data while it's being processed. I'm only three weeks into the course, but so far, only few things in this toolkit here sound familiar. Could you put it to any good use?
Best regards
- Mark as Read
- Mark as New
- Bookmark
- Permalink
- Report to a Moderator
Can we use this tool kit along with the FPGA module ?
- Mark as Read
- Mark as New
- Bookmark
- Permalink
- Report to a Moderator
The toolkit will work on the 'RT' or 'Host' side, but not on the FPGA side. But if you transfer the data between environments, it should work...
- Mark as Read
- Mark as New
- Bookmark
- Permalink
- Report to a Moderator
How to do it ?
- Mark as Read
- Mark as New
- Bookmark
- Permalink
- Report to a Moderator
This link below will help you understand how to develop an application for FPGA:
But, at this time, the toolkit is not supported directly on target. You have to use any RT or Host target for the processing... Hopefully this helps.
- Mark as Read
- Mark as New
- Bookmark
- Permalink
- Report to a Moderator
Will the machine learning toolkit support NI LabVIEW 2013 64bit?
Solutions Manager, Industrial IoT: Condition Monitoring and Predictive Analytics
cbt
512 431 2371
preston.johnson@cbtechinc
- Mark as Read
- Mark as New
- Bookmark
- Permalink
- Report to a Moderator
Yes. The toolkit is purely written in G code. It should work well with LV 2013.
- Mark as Read
- Mark as New
- Bookmark
- Permalink
- Report to a Moderator
Yes - it installs nicely in LabVIEW 2013 32bit, but will not install in LabVIEW 2013 64bit. Is there a way to install it on 64bit LabVIEW?
Solutions Manager, Industrial IoT: Condition Monitoring and Predictive Analytics
cbt
512 431 2371
preston.johnson@cbtechinc
- Mark as Read
- Mark as New
- Bookmark
- Permalink
- Report to a Moderator
You could download Machine Learning Toolkit Manually Install.zip from this page, and unzip to <LabVIEW>\vi.lib\addons\, then relaunch LV.
- Mark as Read
- Mark as New
- Bookmark
- Permalink
- Report to a Moderator
Thanks, I have unzipped to vi.lib\addons and relaunched labview. However, the functions menu does not have the VIs in the pallette. Is there something I need to do with a .mnu file?
Thanks
Prestonj
Solutions Manager, Industrial IoT: Condition Monitoring and Predictive Analytics
cbt
512 431 2371
preston.johnson@cbtechinc
- Mark as Read
- Mark as New
- Bookmark
- Permalink
- Report to a Moderator
I made the mistake of copying the manually install folder, instead of one level lower, the machine learning toolkit. all is working now. Thanks
Preston
Solutions Manager, Industrial IoT: Condition Monitoring and Predictive Analytics
cbt
512 431 2371
preston.johnson@cbtechinc
- Mark as Read
- Mark as New
- Bookmark
- Permalink
- Report to a Moderator
Does anyone know roughly how much is the software, can not find a online price.
how long does the trial version expire?
Many thanks
- Mark as Read
- Mark as New
- Bookmark
- Permalink
- Report to a Moderator
The MLT is free to use, I believe. However, if you mean LabVIEW that'll run for 30 days and then around $1500 a year and then some more on top for various tools and plug-ins. There should also be a student version of LabVIEW available which runs for half a year.
- Mark as Read
- Mark as New
- Bookmark
- Permalink
- Report to a Moderator
Thanks, Whitenoiz.
- Mark as Read
- Mark as New
- Bookmark
- Permalink
- Report to a Moderator
Hi,
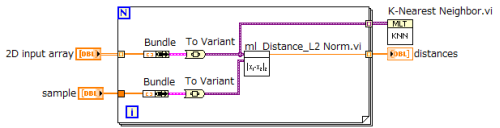
I am trying to use k-NN classifier. My training data has got 11 samples with nine features each. So my training data is a 11*9 2D array. I need them to be classified into 2 groups. From my understandning, the input to the 'examples' in the k-NN tool requires a 1D array. Can someone suggest a way about giving the inout?
Thank you,
Vysh
- Mark as Read
- Mark as New
- Bookmark
- Permalink
- Report to a Moderator
Hi Vysh.
It seems to me that you need to format each of your samples (each sample a 1D feature array) into first a cluster containing the feature array and then into a variant (to avoid coercion dots) if you plan to use the distance VIs contained in the toolkit. For example, opening "ml Distance_L2 Norm.vi" it is possible to confirm that inside each variant is converted back into a cluster containing a 1D feature array.
- Mark as Read
- Mark as New
- Bookmark
- Permalink
- Report to a Moderator
Hi Vysh, I had the same problem and I think you want this solution: 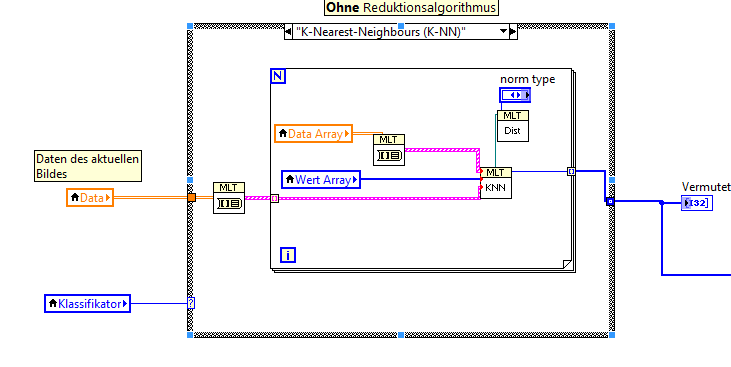 Best regard, K. Standke
- Mark as Read
- Mark as New
- Bookmark
- Permalink
- Report to a Moderator
Hi guys,
I am new here, really want make this tookit work. Now i have some trouble in papare data too.
I have 300 samples, each sample have 217 features, each sample has a class lable, could anyone can give me some instructions about how to use machine learning toolkit to make the classification work?
Thanks!
- Mark as Read
- Mark as New
- Bookmark
- Permalink
- Report to a Moderator
Hi,
I am trying to use the knn supervised learning algorithm. Looking into the code I saw a possible error.
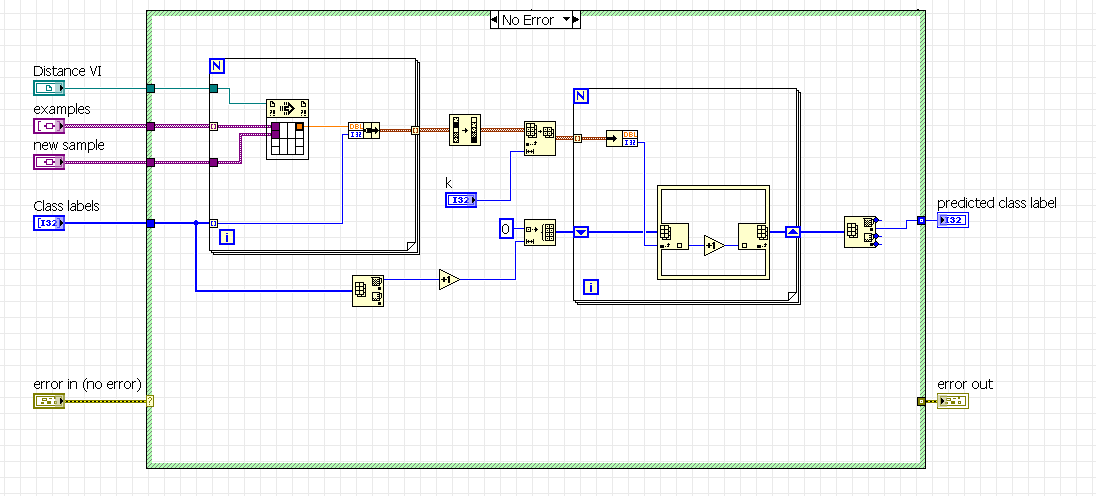
In the function "Array max & min" it should be returned the max value (as in the original program) or the max index as in the picture? If I understand correctly the program flow, the original vi is not correct as the predicted class label shold be returned by the max index.
- Mark as Read
- Mark as New
- Bookmark
- Permalink
- Report to a Moderator
Hi Aldus.
I am just familiarizing with this toolkit, however, I agree with your observation.
Returning the maximum value in the array is equivalent to returning the maximum number of votes a class received. Instead, one would want to return the label of the class that got the maximum number of votes, which is the maximum value index, as you point out.
- Mark as Read
- Mark as New
- Bookmark
- Permalink
- Report to a Moderator
Hi All,
I want to segment a color image based on unsupervised k means clustering. However I am unable to understand how to use the k means clustering on an image. Can anyone shed some light on it?
Any suggestions will be helpful.
Thanks.
regards
Aveo
- Mark as Read
- Mark as New
- Bookmark
- Permalink
- Report to a Moderator
Hey there
For anyone else that is searching this, I am running LV 2014 under Linux distro OpenSUSE 13.1 and the MLT seems to install fine and work fine
- Mark as Read
- Mark as New
- Bookmark
- Permalink
- Report to a Moderator
Here in this link to the LAVA website is some code I developed for classification problems. The methods used are Multiple Discriminant Analysis, and Partial Least Squares Discriminant Analysis. At least, they're supposed to be. I've tried them and they seem to work, but I offer no guarantees.
The software requires Matrix/Linear Algebra functions (available in Labview Full), and a lot of MGI utilities which you can install using VI Package Manager.
- Mark as Read
- Mark as New
- Bookmark
- Permalink
- Report to a Moderator
Hi All,
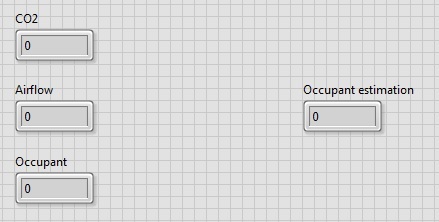
I am a new user in Labview, I want to do live training using MLT BP Neural network, I have no idea where to start, please help me to arrange the block diagram. I have 2 inputs and 1 target, after trained I hope I can get 1 output as estimation value.
Thank you,
- Mark as Read
- Mark as New
- Bookmark
- Permalink
- Report to a Moderator
Hi Haolia,
Perhaps the following example can help you better understand how to use the BP NN:
Example_BP Network_Classification.vi
Be sure to download the toolkit's examples file (Machine Learning Toolkit Examples.zip)
- Mark as Read
- Mark as New
- Bookmark
- Permalink
- Report to a Moderator
Great Work! I would like to use this toolkit for pattern recognition and I tried the last two days to feed the input neurons with my dataset. Unfortunately my trying failed. Is there any documentation how to prepare the dataset?
- Mark as Read
- Mark as New
- Bookmark
- Permalink
- Report to a Moderator
Hey,
Im new to Machine Learning and im very keen to learn it using LabVIEW. I have the basics of LabVIEW but want to proceed further. So can any one give me few suggestions regarding the books and websites that offer knowledge about machine learning using LabVIEW??
I would be very glad to them thank you..
- Mark as Read
- Mark as New
- Bookmark
- Permalink
- Report to a Moderator
how can I use the svm tool for 3D data (increase the input data colum form 2 to 3)? I try the svm example and change the parameter from 2 to 3 but the vi return error and failed.
thanks !
- Mark as Read
- Mark as New
- Bookmark
- Permalink
- Report to a Moderator
sorry, my fault, there is no limit about data array, it works so great, the svm result is so closed to rapid miner, thank you for your sharing.
- Mark as Read
- Mark as New
- Bookmark
- Permalink
- Report to a Moderator
- Mark as Read
- Mark as New
- Bookmark
- Permalink
- Report to a Moderator
I can't see to find out where to download this - can somebody post fresh links?
The top of this post says:
- Download and unzip the latest installer from NI Labs. Run Setup.exe.
But I can't find out where that is.
Thank you.
- Mark as Read
- Mark as New
- Bookmark
- Permalink
- Report to a Moderator
The setup.exe is inside the installer ZIP file, which is listed at the end of the document above. You need to download and extract the contents of the ZIP file and then run setup.exe.
http://forums.ni.com/ni/attachments/ni/7324/229/2/Machine%20Learning%20Toolkit%20Installer.zip

Christian L, CLA
Systems Engineering Manager - Automotive and Transportation
NI - Austin, TX
- Mark as Read
- Mark as New
- Bookmark
- Permalink
- Report to a Moderator
Hi All,
I am a new user in Labview, I want to use MLT BP Neural network, I have no idea where to start, please help me.
- Mark as Read
- Mark as New
- Bookmark
- Permalink
- Report to a Moderator
Hi, Is that possible to use k-fold cross validation rather than hold-out using MLT. I have two class.
Looking forward to receive some valuable input.
- Mark as Read
- Mark as New
- Bookmark
- Permalink
- Report to a Moderator
Hi,
I am using the SVM example, I need to classify more than two classes (margins). For example, I set the label from 0 to 5, but it only classify 0 or 1. I think this case is one v.s. one. If I want to classify more than 2 classes (multi class), how to train SVM more than two groups?
Thanks
Regards.
Neil Lee
freedom21596@gmail.com
- Mark as Read
- Mark as New
- Bookmark
- Permalink
- Report to a Moderator
Hi, I have used an ECG dataset for SVM-based classification. On processing the ECG dataset (2D) using the SVM_example.vi, I am getting accuracy = 64.4%. For the same ECG dataset (2D) using a python code, the accuracy is 88%. How can I modify the SVM_example.vi to improve the accuracy?
