- Subscribe to RSS Feed
- Mark Topic as New
- Mark Topic as Read
- Float this Topic for Current User
- Bookmark
- Subscribe
- Mute
- Printer Friendly Page
Multiple, unit-different Y-axis in NI Graph using VS2013/.NET
Solved!11-11-2015 08:14 AM
- Mark as New
- Bookmark
- Subscribe
- Mute
- Subscribe to RSS Feed
- Permalink
- Report to a Moderator
Hi
Is there a way to make tow different Y axis from both the right and left sides of the graph, with different scal, sharing the same X axis?
How does one refer in code to these?
Thanks
Solved! Go to Solution.
11-12-2015 12:03 PM
- Mark as New
- Bookmark
- Subscribe
- Mute
- Subscribe to RSS Feed
- Permalink
- Report to a Moderator
Hi Gabe 1977,
You can edit the Y Axes on your graph by right-clicking the graph and selecting "Edit YAxes...". Here, you can add multiple axes and, under Layout in the Properties tab, you can edit the CaptionPosition and Position of each axis. You can set the these properties to Left for one axis and Right for the other.
Hope this helps!
11-15-2015 01:03 AM
- Mark as New
- Bookmark
- Subscribe
- Mute
- Subscribe to RSS Feed
- Permalink
- Report to a Moderator
Hi Jupiter02
First, thanks.
I am talking about visual studio. I couldn't find the properties you wrote about...
11-16-2015 10:15 AM
- Mark as New
- Bookmark
- Subscribe
- Mute
- Subscribe to RSS Feed
- Permalink
- Report to a Moderator
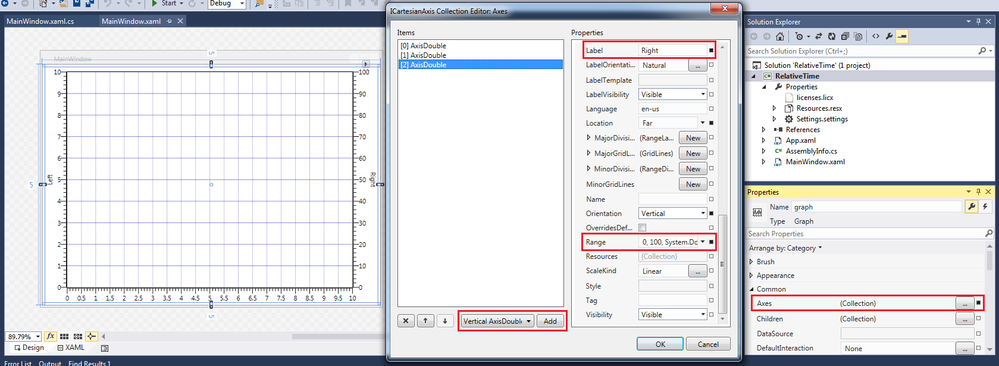
Julia's response correctly describes how to configure the Windows Forms graph control in Visual Studio. If you are using the WPF graph control, the procedure is a little different:
- Select the graph in the Visual Studio designer.
- In the Properties window, open the dialog to edit
Axes. - At the bottom of the collection editor dialog, select "Vertical AxisDouble" and Add two instances.
- Configure the
Locationof each axis to the Near or Far side of the graph. - Configure the
LabelandRangeto distinguish the two axes. - Set a unique
Nameif you want to refer to the axis in code.
You can also add multiple axes in XAML or code, as described in the Configure Measurement Studio WPF Graph Control Axes and Cursors how-to topic (it is the last example in the Axes table).
11-17-2015 01:47 AM
- Mark as New
- Bookmark
- Subscribe
- Mute
- Subscribe to RSS Feed
- Permalink
- Report to a Moderator
Thanks!
02-10-2017 12:57 PM
- Mark as New
- Bookmark
- Subscribe
- Mute
- Subscribe to RSS Feed
- Permalink
- Report to a Moderator
Hi Paul,
I have 2 ni:AxisDouble but I'm not sure how distribute data between them.
My data object is double[4][] and I'd like to apply the 4th data set to the Far axis.
Could you please let me know how this works? At the moment they are all related to the main axis.
Thanks!
02-10-2017 01:14 PM - edited 02-10-2017 01:20 PM
- Mark as New
- Bookmark
- Subscribe
- Mute
- Subscribe to RSS Feed
- Permalink
- Report to a Moderator
To associate a plot with a particular vertical scale, you will need to set the VerticalScale property on that plot. For your case, where you want to associate the fourth plot with the second vertical axis, you can setup your XAML like this:
<ni:Graph ...>
<ni:Graph.Axes>
<ni:AxisDouble x:Name="v1" Orientation="Vertical" ... />
<ni:AxisDouble x:Name="v2" Orientation="Vertical" ... />
</ni:Graph.Axes>
<ni:Graph.Plots>
<ni:Plot Label="First Plot" />
<ni:Plot Label="Second Plot" />
<ni:Plot Label="Third Plot" />
<ni:Plot Label="Fourth Plot" VerticalScale="{Binding ElementName=v2}" />
</ni:Graph.Plots>
</ni:Graph>
02-10-2017 03:20 PM
- Mark as New
- Bookmark
- Subscribe
- Mute
- Subscribe to RSS Feed
- Permalink
- Report to a Moderator
Thank you!
02-28-2019 12:58 PM
- Mark as New
- Bookmark
- Subscribe
- Mute
- Subscribe to RSS Feed
- Permalink
- Report to a Moderator
Hello.
I understand how to assign a plot to a second axis (e.g. on the right side of the graph) at design time using the property page. However, I require making the assignment at run time. I have 2 Y Axes, index values 0 and 1 from the YAxis property pages at design time. The following code does not work (everything is plotted on YAxis1 (index 0):
For i = 1 To gintNumStripChartItems
'Sets the line color for each sensor on the chart
Strip.Plots.Item(i - 1).LineColor = gaStripChartItem(i).Color
'Sets the line width for each sensor on the chart
Strip.Plots.Item(i - 1).LineWidth = 2
''Assign a plot to the proper Y axis (left or right, since there are only 2)
Strip.Plots.Item(i - 1).YAxis = Strip.YAxes.Item(gaStripChartItem(i).TrackID)
Next
The variable gaStripChartItem(i).TrackID has the values 0 or 1 only.
What am I doing wrong here ?
Thank you

