- Subscribe to RSS Feed
- Mark Topic as New
- Mark Topic as Read
- Float this Topic for Current User
- Bookmark
- Subscribe
- Mute
- Printer Friendly Page
property nodes chart align
03-30-2006 07:38 AM
- Mark as New
- Bookmark
- Subscribe
- Mute
- Subscribe to RSS Feed
- Permalink
- Report to a Moderator
I am displaying data from 4 channels each on a seperate chart. I am using plot area and position property nodes to fix the size of each of these charts.
I need auto-scaling but because of this, the charts are not aligned properly.
Is there a way to fix the beggining of the plot area such that all the charts are aligned properly ?
03-31-2006 11:05 AM
- Mark as New
- Bookmark
- Subscribe
- Mute
- Subscribe to RSS Feed
- Permalink
- Report to a Moderator
03-31-2006 11:08 AM - edited 03-31-2006 11:08 AM
- Mark as New
- Bookmark
- Subscribe
- Mute
- Subscribe to RSS Feed
- Permalink
- Report to a Moderator
I'm a little confused by your description. Are you moving the plot areas around during run-time? Otherwise, why would you explicitly set the plot area size and position during run-time, rather than using edit-mode alignment operations shown below:
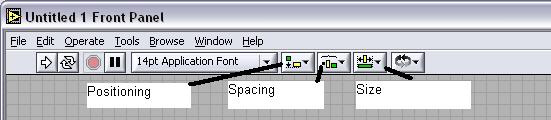
Also, auto-scaling on your graph shouldn't change its size or position. It might help if you posted a VI that demonstrated some of your concerns.
Message Edited by Jarrod S. on 03-31-2006 11:09 AM
National Instruments
03-31-2006 02:41 PM
- Mark as New
- Bookmark
- Subscribe
- Mute
- Subscribe to RSS Feed
- Permalink
- Report to a Moderator
I am using a NI cRIO 9215.
The user might choose how many channels he want to acquire
I need auto-scaling the Y axis, but because of this, the charts are not aligned properly.
Depending on the value on Y axis, two (ore more) charts may have different bounds ( because I setted the plot area property node)
03-31-2006 02:54 PM - edited 03-31-2006 02:54 PM
- Mark as New
- Bookmark
- Subscribe
- Mute
- Subscribe to RSS Feed
- Permalink
- Report to a Moderator
It sounds like with autoscaling on, the Y-scale range will occationally and when this does the plotting area is shifting to allow the Y-axis units to be shown.
Try checking the "use minimum field width"
See image below.

Ben
Message Edited by Ben on 03-31-200602:55 PM
03-31-2006 03:41 PM
- Mark as New
- Bookmark
- Subscribe
- Mute
- Subscribe to RSS Feed
- Permalink
- Report to a Moderator
