- Subscribe to RSS Feed
- Mark Topic as New
- Mark Topic as Read
- Float this Topic for Current User
- Bookmark
- Subscribe
- Mute
- Printer Friendly Page
programmatically profile memory usage on multiple VIs
08-10-2007 01:43 PM
- Mark as New
- Bookmark
- Subscribe
- Mute
- Subscribe to RSS Feed
- Permalink
- Report to a Moderator
08-13-2007
01:42 PM
- last edited on
05-09-2025
09:53 AM
by
![]() Content Cleaner
Content Cleaner
- Mark as New
- Bookmark
- Subscribe
- Mute
- Subscribe to RSS Feed
- Permalink
- Report to a Moderator
Hi there,
You can write the result to an array or some other type of storage and then write that to a file using the Write to Spreadsheet File.vi amongst others (see the File I/O Palette under Functions on the Block Diagram). Let me know if you have any questions!
Stephanie
08-13-2007 02:53 PM
- Mark as New
- Bookmark
- Subscribe
- Mute
- Subscribe to RSS Feed
- Permalink
- Report to a Moderator
Understanding how to programmatically set up and run the profiler is where I need help. I couldn't find any functions that dealt with the memory profiler.
08-14-2007 10:10 AM
- Mark as New
- Bookmark
- Subscribe
- Mute
- Subscribe to RSS Feed
- Permalink
- Report to a Moderator
As far as I know of, there is no way to programmatically set up your memory profiler in LabVIEW. You can however, mimic key stokes with some sort of script that can then click the appropriate buttons/checkbuttons for your profiler, but as far as I can tell, there isnt a direct way to progammatically set it up in LabVIEW.
I hope this helps,
Regards,
Nadim
Applications Engineering
National Instruments
12-07-2020
01:09 AM
- last edited on
05-09-2025
09:54 AM
by
![]() Content Cleaner
Content Cleaner
- Mark as New
- Bookmark
- Subscribe
- Mute
- Subscribe to RSS Feed
- Permalink
- Report to a Moderator
I'm looking for this exact features of profiling set of VIs programmatically while the application runs. I got some hindsight that VI Analyzer toolkit and Log VI Data can help with this. Anyone successful in this?
12-07-2020 06:41 AM - edited 12-07-2020 07:07 AM
- Mark as New
- Bookmark
- Subscribe
- Mute
- Subscribe to RSS Feed
- Permalink
- Report to a Moderator
I'd start searching in C:\Program Files\National Instruments\LabVIEW 20xx\project\_ProfileBufferAllocations.llb
Now a lot of this is PW protected (EDIT: actually, a lot isn't but the interesting parts are), the main VI is completely obfuscated (no diagram, not a normal VI).
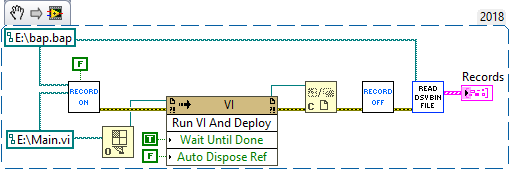
Turn On LV Profiling.vi and Turn Off LV Profiling.vi are pretty autonomic though.
What I get from other VIs (Read PBA Bin File API.vi, etc.) it seems that enabling profiling creates a file somewhere that can be read... EDIT: Turn On LV Profiling.v takes a path to a BAP file. That could be the PBA file?
12-07-2020 07:27 AM
- Mark as New
- Bookmark
- Subscribe
- Mute
- Subscribe to RSS Feed
- Permalink
- Report to a Moderator
This gives me results.
But it's tricky! It only gives results for (sub) VIs that executed. Also execution of those VIs is somehow blocked by the profiler. My test.vi (that should be a path of course) didn't execute until I continued from that 1st brakepoint. It's probably designed to run in another context...
The results are somewhat cryptic as well. But that's what you get once you go low level...
12-07-2020 07:31 AM - edited 12-07-2020 07:37 AM
- Mark as New
- Bookmark
- Subscribe
- Mute
- Subscribe to RSS Feed
- Permalink
- Report to a Moderator
I think this works mostly as expected, and does everything asked for?
Except "Also, how can I save the results into a spreadsheet?". I hope that's clear now we can get data? It's really a completely different topic.


