- Subscribe to RSS Feed
- Mark Topic as New
- Mark Topic as Read
- Float this Topic for Current User
- Bookmark
- Subscribe
- Mute
- Printer Friendly Page
exact position of mouse click on xy graph while plotting graph with mouse events
Solved!02-05-2009 04:46 AM - edited 02-05-2009 04:49 AM
- Mark as New
- Bookmark
- Subscribe
- Mute
- Subscribe to RSS Feed
- Permalink
- Report to a Moderator
hi
iam using xy graph for multi plots
iam plotting graph with mouse move and down events using the attached example (draw graph with mouse events)
but in sub vi Scale Values.vi there are two constants 66 and 30 when i change my plot (i also change the scales) then the mouse position and graph value position(cursor) are not properly aligned but when i change the above mentioned constants i get the perfect alignment between cursor and last point of plot.
as i switched to another plot (with new scaling) the same problem of misalignment resurfaces.
i need to replace those two constants with something dynamic
please provide assistance
regards
mazhar
Solved! Go to Solution.
02-05-2009 06:35 AM - edited 02-05-2009 06:36 AM
- Mark as New
- Bookmark
- Subscribe
- Mute
- Subscribe to RSS Feed
- Permalink
- Report to a Moderator
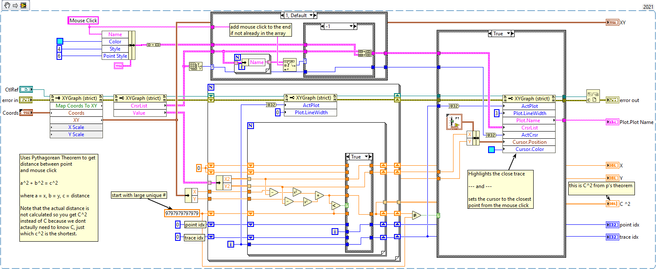
What about the 'Map Coords TO XY' method:

Ton
Nederlandse
My LabVIEW Ideas
LabVIEW, programming like it should be!
02-05-2009 06:46 AM - edited 02-05-2009 06:48 AM
- Mark as New
- Bookmark
- Subscribe
- Mute
- Subscribe to RSS Feed
- Permalink
- Report to a Moderator
Here's an updated screenshot of your code:

My suggestion is to look at my nugget on Dynamic event Registration to limit the event rate when you don't have the mouse down in side the xy-control.
Ton
Nederlandse
My LabVIEW Ideas
LabVIEW, programming like it should be!
02-12-2009 07:33 AM
- Mark as New
- Bookmark
- Subscribe
- Mute
- Subscribe to RSS Feed
- Permalink
- Report to a Moderator
thanx man for your time and interest
your solution is also quite right but
iam using cluster of two arrays for my plot.
i have fixed my problem.
now it work fine.
regards
mazhar
02-18-2009 04:15 AM
- Mark as New
- Bookmark
- Subscribe
- Mute
- Subscribe to RSS Feed
- Permalink
- Report to a Moderator
02-08-2010 01:10 PM
- Mark as New
- Bookmark
- Subscribe
- Mute
- Subscribe to RSS Feed
- Permalink
- Report to a Moderator
Your code works...but is not quite there yet. You can get -negative number outside the plot axis values while selecting.
You need to constrain the XY mouse coordinates before you push it to your coordinate array. Otherwise you'll get some insane values.
Get the X&Y Scale Range:Max\Min and use that to constrain the returned mouse values.
Regards
Jack
02-08-2010 01:32 PM
- Mark as New
- Bookmark
- Subscribe
- Mute
- Subscribe to RSS Feed
- Permalink
- Report to a Moderator
08-25-2023 11:33 AM
- Mark as New
- Bookmark
- Subscribe
- Mute
- Subscribe to RSS Feed
- Permalink
- Report to a Moderator
This is an old post but I forgot the name of the method that that does this so I am happy this info was here. In case someone else is looking here and needs a nice plot tool, I made an VI that finds and highlights the closest data point / trace when a user clicks on an XY Graph.
Just add it to the mouse down event like this:
Have a pleasant day and be sure to learn Python for success and prosperity.


