- Subscribe to RSS Feed
- Mark Topic as New
- Mark Topic as Read
- Float this Topic for Current User
- Bookmark
- Subscribe
- Mute
- Printer Friendly Page
csv files
Solved!04-04-2016 01:31 PM
- Mark as New
- Bookmark
- Subscribe
- Mute
- Subscribe to RSS Feed
- Permalink
- Report to a Moderator
hello to all, how are you?
I am working on a software to make measurement using my railroad drone.
My drone generate csv files ( as attached).
The first colum is the distance that the encoder generate, the seconde colum is generated by inclinometer.
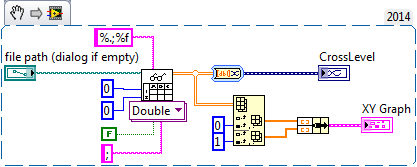
But if I open data, for example Crosslevel, the distance on my VI, in the first graph called CrossLevel, the distance doesnt match the values of the csv file (first colum on excel), the distance on X showes how many lines the form has on excel (crosslevel showes 54, should be starting on 0,004 and finishing on 4,924
On software the ditance on X shows how many lines there are on excel chart
the Y values are correct
basicaly I need a XY graph with correct values from csv files
I have tried to separate values from first and second colum of the csv files but I didnt got
Is there any way to make the Graph shows value as I want?
To read the data on my VI, open the VI and on those 3 paths just enter the value that match each path, then press the red button besides STOP button. the software only will work if you enter all 3 csv files
The VI and those 3 csv are attached.
Thank you so much
Sorry about my bad english
Solved! Go to Solution.
04-04-2016 02:20 PM
- Mark as New
- Bookmark
- Subscribe
- Mute
- Subscribe to RSS Feed
- Permalink
- Report to a Moderator
Why are you use dynamic data?
You transform array to DD and again to array.
There is way to draw your data on XY graph.
Also your transform function makes 2 channels signal but not xy-signal
04-04-2016 03:17 PM
- Mark as New
- Bookmark
- Subscribe
- Mute
- Subscribe to RSS Feed
- Permalink
- Report to a Moderator
Hello Artem, how are you?
thank you so much, this is perfect
this morning I tried, but my mistake was no using bundle. I was trying to figure it out usig two graphs andcreating relation between them.
also the format os spreadsheet was wrong, I used the same you used and everything is runing perfect now
thank you so much and I've realy apreciated


