- Subscribe to RSS Feed
- Mark Topic as New
- Mark Topic as Read
- Float this Topic for Current User
- Bookmark
- Subscribe
- Mute
- Printer Friendly Page
- « Previous
-
- 1
- 2
- Next »
XY Graph => to put array of string to X scale .
Solved!07-03-2017 07:22 AM
- Mark as New
- Bookmark
- Subscribe
- Mute
- Subscribe to RSS Feed
- Permalink
- Report to a Moderator
it works,
Thank you very much .Citation
11-09-2020 05:28 PM
- Mark as New
- Bookmark
- Subscribe
- Mute
- Subscribe to RSS Feed
- Permalink
- Report to a Moderator
Hi,
I need to plot a XY graph but on the X-abscis there needs to come string of a date.
I tried already the VI that stands here but is don't find the solution.
In the picture you see the data that needs to come in the graph. "prijs" on the Y-abcis and "datum" on the X-abcis. The problem is that the array of "datums" is an array of string.
Hopefully you can give me a solution on this problem.
Regards, Arthur
11-10-2020 12:39 AM
- Mark as New
- Bookmark
- Subscribe
- Mute
- Subscribe to RSS Feed
- Permalink
- Report to a Moderator
Hi ArhurMalengier,
As you mentioned that both datums and prijs are array of strings,you need to convert them respectively to array of time stamps and array of doubles respectively.And also you need to set the 'displayformat' of X-scale in XY graphs properties to Absolute time with Y/M/D as below:
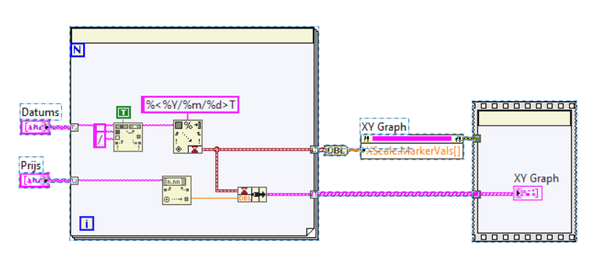
The conversion of datums string array to timestamp array is trickier part.I had copy pasted the block diagram where i had tested for 8 elements of datums and prijs each..you can use it for all data which you have.
11-10-2020 05:24 AM
- Mark as New
- Bookmark
- Subscribe
- Mute
- Subscribe to RSS Feed
- Permalink
- Report to a Moderator
Hi,
My x abcis stand in the right format but i don't get my datums on my x abcis. In the picture you see what i have already now.
Regards, Arthur
11-10-2020 06:14 AM
- Mark as New
- Bookmark
- Subscribe
- Mute
- Subscribe to RSS Feed
- Permalink
- Report to a Moderator
11-10-2020 06:37 AM
- Mark as New
- Bookmark
- Subscribe
- Mute
- Subscribe to RSS Feed
- Permalink
- Report to a Moderator
Hi,
I don't now exactly haw many times i need te run the loop.
In attach you see the Vi.
The project is about requesting shares and their price. These prices has to come in a graph with on the x abcis the date and on the y abcis the prices.
Regards, Arthur
11-10-2020 06:52 AM - edited 11-10-2020 06:53 AM
- Mark as New
- Bookmark
- Subscribe
- Mute
- Subscribe to RSS Feed
- Permalink
- Report to a Moderator
Hi Arthur,
@ArthurMalengier wrote:
I don't now exactly haw many times i need te run the loop.
You know that! You already created arrays from Date/Price!
Simple solution:

11-10-2020 07:14 AM
- Mark as New
- Bookmark
- Subscribe
- Mute
- Subscribe to RSS Feed
- Permalink
- Report to a Moderator
Hi,
It works perfectly, big thanks!
Regards, Arthur
- « Previous
-
- 1
- 2
- Next »


