- Subscribe to RSS Feed
- Mark Topic as New
- Mark Topic as Read
- Float this Topic for Current User
- Bookmark
- Subscribe
- Mute
- Printer Friendly Page
Waveform Measurement
05-20-2008 09:23 AM
- Mark as New
- Bookmark
- Subscribe
- Mute
- Subscribe to RSS Feed
- Permalink
- Report to a Moderator
05-21-2008 03:34 PM - edited 05-21-2008 03:35 PM
- Mark as New
- Bookmark
- Subscribe
- Mute
- Subscribe to RSS Feed
- Permalink
- Report to a Moderator
First I am curious how you got this waveform in the first place.
To answer your question.
You can create cursors on the front panel of the waveformGraph.
to do so:
1. Righ-click on the waveformGraph on the front panel>>Visible Items>>Cursors Legend
2. Right-click on the cursor legend and create a cursor>>select the cursor target (on the bottome right of the graph to allow you to select the cursor position)
You are now able to see the Y value for its corresponding X values.
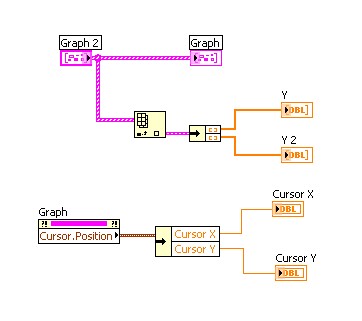
This graph is made out of a 1D Array of Cluster, with the cluster containing 2 1D array of Doubles.
In order to have access to these sub arrays that make up this waveform graph, you can first use the Index Array to extract the first and only element>>then unbundle the cluster.
To take advantage of the cursor you created on the wavefromGraph, please create a property node to the waveformgraph (rightclick the waveformgraph>>create>>property node>>cursor>>cursor position)
Then you'll have access to the actual X and Y value of the cursor.
To perform slope calculation, you can create 2 cursors and do mathematical functions on them.
Hope this helps
Message Edited by Van_L on 05-21-2008 03:35 PM
NI Applications Engineer
05-27-2008 02:35 PM
- Mark as New
- Bookmark
- Subscribe
- Mute
- Subscribe to RSS Feed
- Permalink
- Report to a Moderator
That was just something on my desk i scanned in and profiled with a measurement laser. I had pretty much done what you had described with measuring the slopes, i just did it by steping through the arrays at various points and calculating the slope in relation to the previous sample, which i am guessing would be very similar to setting two cursors and calculating slope that way. I am not 100% convinced measuring the slopes is the way to go with this, i am worried that as i walk down a radius on an object calculating the slope will give me false "bumps". If i reduce the number of samples between where i calculate my slope this would help clean up the radius problem but im thinking it would also make my scanning very susceptible to the surface finish on the object. A rough surface finish would produce large slopes if i calculated them point to point.
I was hoping for some magical algorithm i could pump these arrays through but it doesnt look i am getting that lucky....
