- Subscribe to RSS Feed
- Mark Topic as New
- Mark Topic as Read
- Float this Topic for Current User
- Bookmark
- Subscribe
- Mute
- Printer Friendly Page
Waveform Chart Digital Display Blinks 0.00
04-16-2019 05:22 AM - edited 04-16-2019 05:23 AM
- Mark as New
- Bookmark
- Subscribe
- Mute
- Subscribe to RSS Feed
- Permalink
- Report to a Moderator
@Ben wrote:I was never able to come up with a example where NI could duplicate the issues.
I did yesterday morning since I started noticing the blinking "0" on one of my VIs. It is somehow related to having a waveform data type for the chart. I was unable to get it to reproduce with a scaler or array data type.
VI saved in 2016, but I confirmed the issue in 2018 SP1.

There are only two ways to tell somebody thanks: Kudos and Marked Solutions
Unofficial Forum Rules and Guidelines
"Not that we are sufficient in ourselves to claim anything as coming from us, but our sufficiency is from God" - 2 Corinthians 3:5
04-23-2019 07:55 AM
- Mark as New
- Bookmark
- Subscribe
- Mute
- Subscribe to RSS Feed
- Permalink
- Report to a Moderator
Hey @Crossrulz,
I also recreated this in LabVIEW 2018 SP1, so I'll go ahead and let R&D know. Is this affecting a VI you are developing?
NI Technical Support Engineer
04-24-2019 09:25 AM
- Mark as New
- Bookmark
- Subscribe
- Mute
- Subscribe to RSS Feed
- Permalink
- Report to a Moderator
As a followup, we have documented this in CAR 278457
NI Technical Support Engineer
04-24-2019 11:37 AM - edited 04-24-2019 11:59 AM
- Mark as New
- Bookmark
- Subscribe
- Mute
- Subscribe to RSS Feed
- Permalink
- Report to a Moderator
@crossrulz wrote:
VI saved in 2016, but I confirmed the issue in 2018 SP1.
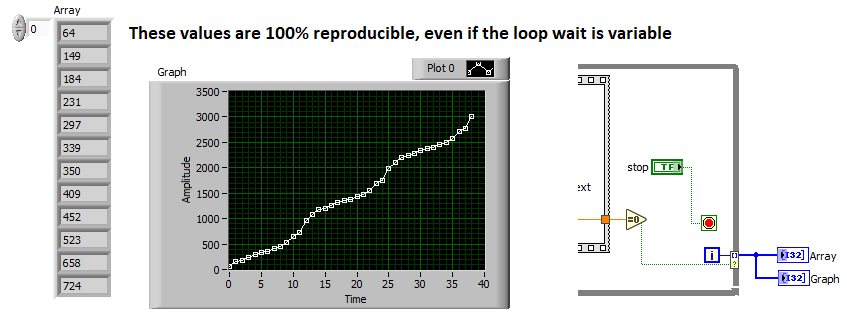
Curiously, [i] is always 64 when the stop occurs. Might be a hint. 😄 In fact all iterations where the zero occurs is always at the same iterations: 64, 149, 184, 231, ...). Tried no wait, 1ms or 5ms wait.
Maybe some numerologist can see a pattern 😄
04-24-2019 11:42 AM - edited 04-24-2019 11:53 AM
- Mark as New
- Bookmark
- Subscribe
- Mute
- Subscribe to RSS Feed
- Permalink
- Report to a Moderator
And here's a picture if the delta(i) between zeroes. Looks like an EKG. Fully repetitive:o
04-26-2019 02:18 PM
- Mark as New
- Bookmark
- Subscribe
- Mute
- Subscribe to RSS Feed
- Permalink
- Report to a Moderator
@altenbach wrote:
Curiously, [i] is always 64 when the stop occurs. Might be a hint. 😄 In fact all iterations where the zero occurs is always at the same iterations: 64, 149, 184, 231, ...). Tried no wait, 1ms or 5ms wait.
OK, this is very confusing, because it seems to depend on other factors. While the values seem to be always the same on the same computer, the result are quite different on another machine:
AMD Ryzen 1700x: 64, 149, 184, 231, etc....
Dual Xeon: 158, 189, 213, 169, 282, etc....
This makes no sense. I wonder if the values change after a reboot, for example. Here's the xeon pairwise difference. Note that the period is now 18 samples long. (was 13 on the AMD)
I wonder what others are getting... 😮
04-26-2019 03:09 PM
- Mark as New
- Bookmark
- Subscribe
- Mute
- Subscribe to RSS Feed
- Permalink
- Report to a Moderator
04-29-2019 02:38 AM
- Mark as New
- Bookmark
- Subscribe
- Mute
- Subscribe to RSS Feed
- Permalink
- Report to a Moderator
Shouldn't some relation to the GPU's refresh rate be expected?
Hide the chart, and you'll get a straight line.
Not sure how that's related to the type pf the data. Also, I'd expect Synchronous Display to make a difference, but it doesn't. Nor does the size of the chart. The chart history length does make a difference.
04-29-2019 08:44 AM - edited 04-29-2019 08:44 AM
- Mark as New
- Bookmark
- Subscribe
- Mute
- Subscribe to RSS Feed
- Permalink
- Report to a Moderator
Do things change if you run Prime95 in parallel?
Or have something else utilising the UI thread?
09-14-2021 01:00 PM
- Mark as New
- Bookmark
- Subscribe
- Mute
- Subscribe to RSS Feed
- Permalink
- Report to a Moderator
Just to give this a bump...I am still seeing this bug in LabVIEW 2021. I do think Christian is on to something. Using the VI I posted earlier, the error always occurs on iteration 50.
NI did give us a CAR number. But since NI no longer uses the CAR database, do we have a new Bug number to reference?
There are only two ways to tell somebody thanks: Kudos and Marked Solutions
Unofficial Forum Rules and Guidelines
"Not that we are sufficient in ourselves to claim anything as coming from us, but our sufficiency is from God" - 2 Corinthians 3:5


