- Subscribe to RSS Feed
- Mark Topic as New
- Mark Topic as Read
- Float this Topic for Current User
- Bookmark
- Subscribe
- Mute
- Printer Friendly Page
Splitting Array with n Elements n times, while the array is filled up (Keithley 2614B)
Solved!02-11-2022 01:24 PM
- Mark as New
- Bookmark
- Subscribe
- Mute
- Subscribe to RSS Feed
- Permalink
- Report to a Moderator
Hi Dear Labview Friends,
I will start with a short Summary:
How do I divide an array of any size at an n location each time a multiple of n is hit.
So if I have an array of my measurements:
Array (1 2 3 1 2 3 1 2 3 1 2 3)
If I want a separation at the places:
1 2 3 | 1 2 3 | 1 2 3 | 1 2 3
Problem is I know how long the array will be at the end but during the measurement it is built parallel to the measurement and entered in a coordinate system. So the option to wait until the array is finished and then separate at each point does not work. The array can vary depending on the measurement size and accordingly one cannot say generally I insert now 4 of the split 1 D array blocks so that I get 4 times 3 array.
Here is the problem again described very precisely I hope you can help me, I start with a short explanation to the old program:D
Old program:
In the old program we measured with a Keithley 2600B which has channel A only.
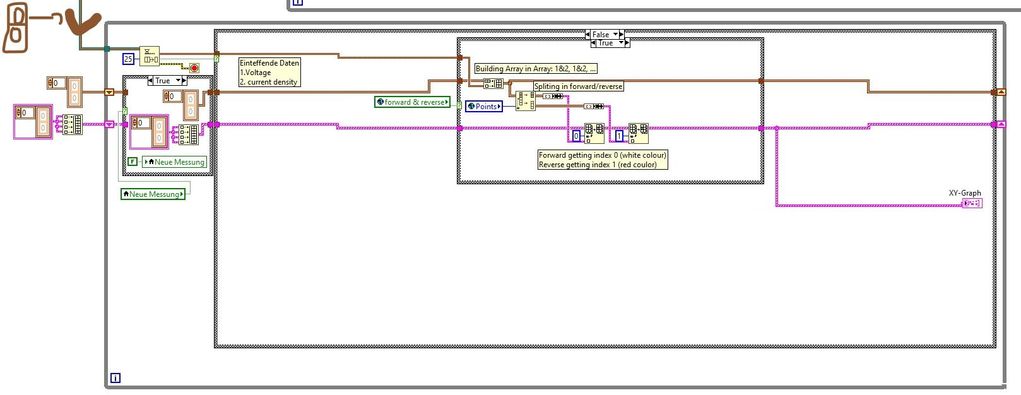
At the beginning you enter start/end voltage and the number of steps. The program goes in a loop through the voltages and measures the current (transform into current density).The data is sent into a queue in the loop you see in the - (this loop is only for inserting the data into a coordinate system in parallel during the measurement):
On the far left, the array is initialized once. The first True/False is only activated if there is a new measurement there everything is set to 0 again. If it is false, the line simply goes through and collects the measured values that arrive at the top in a loop.
In the second box, the measured [voltage, current] number goes into an array of 2, so an array is built from pairs of numbers that becomes longer and longer. Theoretically you would know the length because if you divide start/end by the number of steps you get the number of measurement points, which is also stored as a global variable (Points).
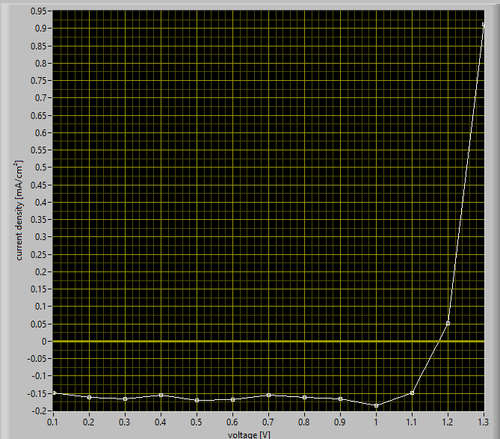
For a measurement from start to end, for example, it starts at 1.3 V, ends at 0.1V with Stepsize 0.1 the point number is 13 (i.e. the measurement points).
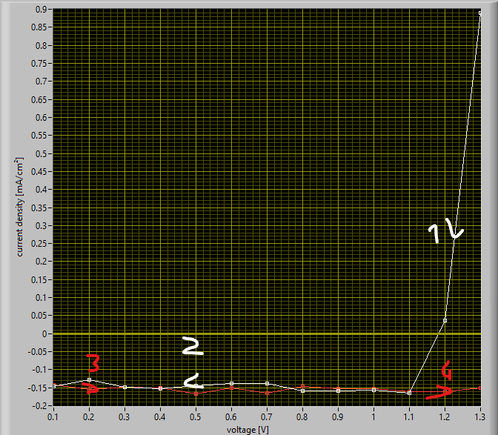
At Start to Start it starts like the other one first from 1.3V to 0.1 after the Point number is exceeded, the array is divided and is entered (in red) from 0.1 to 1.3, in total twice as many measuring points as in the first case.
At Start to Start it starts as in the other case from 1.3V to 0.1 after the Point number is exceeded, the array is divided and is entered (in red) from 0.1 to 1.3, in total twice as many measuring points as in the first case. The array is divided by a Split 1 D array block at the Point position.
Points is only as big as the white lines measurement therefore it is 13 and the Split is at 13/26.
So that's it for the old stand! This all works and is a fine thing. And this is how it should work with the new version
Start to End: Points: n; Measuring points: n (white line only)
Start to Start: Points: n; Measuring points: n*2 (first half white second half red)
New Version:
1st PROBLEM:
In the new program, a Keithley 2614B is used to measure, which has channel A & B.
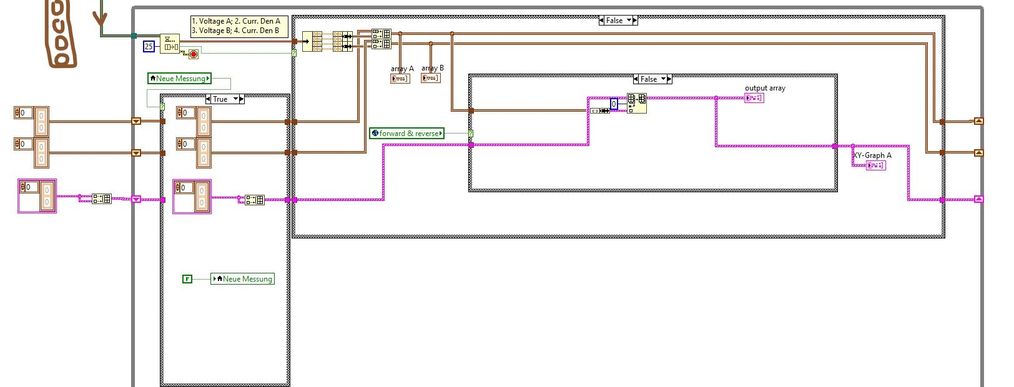
At the beginning you enter start/end voltage and the number of steps for channel A and B. The measuring program then goes through a double loop in the outer loop, channel B is always increased by 1 step when channel A in the inner loop has measured once completely. Then channel B one step further and channel A measures everything again and so on until channel B is finished. Instead of 2 values, there are now 4 values passed: 1. voltage A, 2. current A, 3. voltage B, 4. current B
So the arrays would look like this when I look at the Array Values A and B:
So as I said while array A goes from 0.8 to 1 in 0.1 steps array B stays constant at 0.8 then array B goes to 0.9 and array A goes through the 3 steps again.
The measurement data are not correct now of course, because no sample is connected but the principle behind it is the same😎
If you look at the loop you see that I first divide the data of A and B and make them into 2 separate arrays, because at the end channel A and B will be plotted in two different graphs.
In the - you see again the same as in the previous program the whole initialization stuff on the left side.
I see there is still a pink line missing for the channel B, since I do everything piece by piece I start first with channel A (therefore channel B is missing).
Back to the Problem:)
Unfortunately I can't manage to split the measurement in a meaningful way.
Example I have 3 measuring points at A and 3 at B means channel A measurement is executed 3 times so 9 measuring points but form Start to Start means a total of 18 measuring points (the voltage steps):
Array B: 1 1 1 | 1 1 1 | 2 2 2 | 2 2 2 | 3 3 3 | 3 3 3
Array A: 1 2 3 | 3 2 1 | 1 2 3 | 3 2 1 | 1 2 3 | 3 2 1
(actually every value has a current value which belongs to it but I left that out here for a short time, for overview reasons).
I just can't find a solution how to split the arrays internally again? Probably somehow through a loop, but I'm really biting my teeth
The normal block 1 D array split just doesn't do it, because that can only divide once to a certain number value and if I divide to the points value I would have only 2 arrays. I needed a function that splits an array with n elements regularly at position n (n multiples). So in the case from above at every 3rd place. That would be already a huge step.
2. Problem:
If I do not do a backward measurement, so only Start to End and I get the following (output Array A):
Array B: 1 1 1 | 2 2 2 | 3 3 3
Array A: 1 2 3 | 1 2 3 | 1 2 3
(1 2 3 represent here the steps I marked in the -).
If I just plot it from 1 to 0.8, it jumps also jumps from 0.8 to 1, which is logical because the system thinks that the array continues. Here also the question how do I get it that at the point n I divide the array each time so that the line from point 3 to 1 disappears therefore it always just does 1 2 3 and then does 1 2 3 again and considers it each time as a separate line. I hope it is clear what I mean
Later when tandem solar cells are connected the lines will not overlap like now. So it would be nice if the line from 3 to 1 is not there anymore. Also because then measurements are made with 1000+ points, so it would be a mess haha
I would be happy about your solution suggestions 😀 I will continue to try myself. Maybe with loops to split the whole array. Let's see what I find while trying around:)
Solved! Go to Solution.
02-11-2022 03:21 PM - edited 02-11-2022 03:39 PM
- Mark as New
- Bookmark
- Subscribe
- Mute
- Subscribe to RSS Feed
- Permalink
- Report to a Moderator
@Sebbastiannn wrote:
Hi Dear Labview Friends,
I will start with a short Summary:
How do I divide an array of any size at an n location each time a multiple of n is hit.
So if I have an array of my measurements:
Array (1 2 3 1 2 3 1 2 3 1 2 3)
If I want a separation at the places:
1 2 3 | 1 2 3 | 1 2 3 | 1 2 3
Problem is I know how long the array will be at the end but during the measurement it is built parallel to the measurement and entered in a coordinate system. So the option to wait until the array is finished and then separate at each point does not work. The array can vary depending on the measurement size and accordingly one cannot say generally I insert now 4 of the split 1 D array blocks so that I get 4 times 3 array.
I am not sure about some of the terms you use (e.g. "separation") but basically you need a 1D array of your data structure and a 2D array with three columns where a new row is added whenever the 1D array is full.
Here's a very quick draft that could possibly give you some ideas.
(On a side note: To get help, attaching VIs is recommended. Nobody has time and desire to study a huge collection of static images)
02-12-2022 08:39 AM - edited 02-12-2022 09:18 AM
- Mark as New
- Bookmark
- Subscribe
- Mute
- Subscribe to RSS Feed
- Permalink
- Report to a Moderator
Hey 🙂
Thanks first for your quick response!
Seperation = Splitting the incoming array:) (Sorry for the confusion I am not a native speaker😅)
My problem is that it is not always 3 measurements it can also be something like this:
1 2 3 4 | ...
but also
1 2 ... 1000+| ...
In your case it would be a specific number 🙂
But I think I see what you mean, you could set the number with the measuring points for each run so that the array 1 D array is built, whether it is now 4 or 1000 does not matter in this case:)
Could you also write it into the 1 D Array and 2D array at the same time? or does the 1D array have to be filled before you can write it into the 2 D array?
Array have always been my weakness:D
The program itself I can't post in the forum, or better I'm not allowed to.
I could send you the library with the program private by email 🙂 That's why I only sent pictures.
But I will try with your idea a bit around:)
@altenbach wrote:(On a side note: To get help, attaching VIs is recommended. Nobody has time and desire to study a huge collection of static images)
Edit: Here is the small part of the programm, its not finished yet of course. But iam sure you cant run it because of the missing Script i wrote myself and uploaded on the keithley and the missing keithley of course 😄 but just to watch should work
02-12-2022 11:02 AM - edited 02-12-2022 11:46 AM
- Mark as New
- Bookmark
- Subscribe
- Mute
- Subscribe to RSS Feed
- Permalink
- Report to a Moderator
(Please don't attach archives that require special software to extract (7z). Plain zip files are natively supported in windows, so please use that. You can even use 7zip to create plain zip archives. Also, if you attach a huge hierarchy of files, at least tell us the name of the toplevel VI, especially if it is not even part of the attached project!)
LabVIEW does not have "ragged" 2D arrays, i.e. all rows must be the sane size. However you can do a 1D array of clusters, where each cluster contains a 1D array of data. Now each inner 1D array can be of different length, or even empty.
Here's one possibility:
02-12-2022 11:30 AM
- Mark as New
- Bookmark
- Subscribe
- Mute
- Subscribe to RSS Feed
- Permalink
- Report to a Moderator
02-12-2022 12:23 PM - edited 02-12-2022 12:39 PM
- Mark as New
- Bookmark
- Subscribe
- Mute
- Subscribe to RSS Feed
- Permalink
- Report to a Moderator
thank you again for the quick reply:)
The last one could be interesting!
I will have a look at both, so i can learn from it:) I never worked with " in Place Element Structures" so its very interesting
@altenbach wrote:
And here's how you could update the data structure live.
In fact I also have no ragged arrays:)
If channel B should measure 3 times and channel A 4 times.
Then the array for channel A should look like this
1 2 3 4
1 2 3 4
1 2 3 4
and the array for channel B would be like this:
1 1 1 1
2 2 2 2
3 3 3 3
Because of the double Loop i dont have ragged arrays 🙂 but you can see for yourself in the zip file.
I just have to plot it also in a graph while the array is build 😕 unfortunately I don't know which array format is best for this, so that it works smoothly 🙂
In the end the two arrays have to be in 2 graphs and each array row should be a line in the plot and there should be no plot line when jumping to the next array row.
In the 7zip you will probably also see that the Measurement produce a block of 4 numbers which iam sending via a Queue to an other loop just for the plotting. The next think i have to do is to safe the Data in a meaningful way, but yeah thats a other story 😄
Okay I made it now as 7zip, then you can take a look, I apologize now if it is too messy, I tried to keep it neat but I have not so much Labview experience:) I will remove the old 7z times immediately!
The Programm is in the folder "3K Tandem Kennlinienmessung_auto_voltage" and i marked it with a 1. (1. Measurement Software) the rest are VI´s that are inside of the Measurement Software:)
When you open it the first time it can happen that is looking for the VI´s sometimes he is looking for Config_T but the new name is now Config_T_auto just because i made a copy and dont overwrite my other stuff.
EDIT: okay i cant delete the 7z anymore but i will keep it in mind to only post zip not 7z !
Best Regards,
Basti
02-12-2022 12:36 PM
- Mark as New
- Bookmark
- Subscribe
- Mute
- Subscribe to RSS Feed
- Permalink
- Report to a Moderator
Sorry, I won't be able to look at your code until I am a computer with a larger monitor. (currently on a small laptop).
OK, so a 2D array is correct, you just need to decide on the number of columns before you start building.
If you want to build the rows up as you go, you need to create an entire new row filled with NaN, then replace each point as data comes in. (NaN values will not show on graphs).
02-12-2022 12:48 PM
- Mark as New
- Bookmark
- Subscribe
- Mute
- Subscribe to RSS Feed
- Permalink
- Report to a Moderator
@altenbach wrote:
Sorry, I won't be able to look at your code until I am a computer with a larger monitor. (currently on a small laptop).
No problem:) its also weekend! I was just looking at my Labview Programm because you gave me good input/ideas for experiment. I was curious to understand how it works:)
I'm definitely looking forward to feedback for my problem if you find the time to look at the code on the big screen.
Use myself a monster screen because I can not do that on the laptop haha
I think with the examples that you have sent me I will have a lot of fun tomorrow:)
02-12-2022 01:17 PM - edited 02-12-2022 01:34 PM
- Mark as New
- Bookmark
- Subscribe
- Mute
- Subscribe to RSS Feed
- Permalink
- Report to a Moderator
Here's the NaN idea for plots with incomplete data mentioned earlier.
(I change the points style for each plot because using the default style you cannot see the first point. There are some other subtleties, e.g. we need to ensure that the plot actually exists before we set the active plot)
02-12-2022 01:58 PM - edited 02-12-2022 02:07 PM
- Mark as New
- Bookmark
- Subscribe
- Mute
- Subscribe to RSS Feed
- Permalink
- Report to a Moderator
@altenbach wrote:
Here's the NaN idea for plots with incomplete data mentioned earlier.
(I change the points style for each plot because using the default style you cannot see the first point. There are some other subtleties, e.g. we need to ensure that the plot actually exists before we set the active plot)
Hello,
I think if the x-axis also goes over a random number too and not over time that would be my solution for my coordinate system problem:0 so both axes a random number (in double format).
In my program i would get of course real (double) numbers:)


