- Subscribe to RSS Feed
- Mark Topic as New
- Mark Topic as Read
- Float this Topic for Current User
- Bookmark
- Subscribe
- Mute
- Printer Friendly Page
STFT (spectrogram)
10-23-2011 03:49 AM
- Mark as New
- Bookmark
- Subscribe
- Mute
- Subscribe to RSS Feed
- Permalink
- Report to a Moderator
Hello all!
How can I convert frequency axis to period axis (intensity graph), when STFT-data put into on intensity graph?
10-23-2011 04:42 AM
- Mark as New
- Bookmark
- Subscribe
- Mute
- Subscribe to RSS Feed
- Permalink
- Report to a Moderator
How about connecting period to intensity graph 2D array and single click on frequency label to rename it Period ?
Will that work ?
Kudos are Welcome ![]()
Thanks & Regards,
Kunal Raithatha.
CTD - CLAD (I wish I can take off that A, and maybe use it later to replace D 🙂
Easy Tip :- "To copy an image to a VI icon, drag the image file and place it on the icon
located in the upper right corner of the front panel or block diagram" ...If you know any
more reply back.
-------------------------------------------------------------------------------------------------------------------------------
10-23-2011 05:04 AM - edited 10-23-2011 05:12 AM
- Mark as New
- Bookmark
- Subscribe
- Mute
- Subscribe to RSS Feed
- Permalink
- Report to a Moderator
"How about connecting period to intensity graph 2D array and single click on frequency label to rename it Period " -it will not work.. I think.... ->
-> 2D array STFT-data -it's amplitude(magnitude) array, right? there delta F (step) is linear... (0,01 0,02)
if convert Frequency to Period, then delta Period (step) non-linear, because delaPeriod=1/delta(100 50) F(step increases nonlinear/irregularly).
How can I do it? averybody, help me...
10-23-2011 08:17 AM
- Mark as New
- Bookmark
- Subscribe
- Mute
- Subscribe to RSS Feed
- Permalink
- Report to a Moderator
How to compute 2D array-amplitudes for periods? rather than frequencies...
10-23-2011 10:11 PM
- Mark as New
- Bookmark
- Subscribe
- Mute
- Subscribe to RSS Feed
- Permalink
- Report to a Moderator
what is needed, example:
How Can I do it??? anybody, help me please.
10-24-2011 08:23 AM
- Mark as New
- Bookmark
- Subscribe
- Mute
- Subscribe to RSS Feed
- Permalink
- Report to a Moderator
To convert from frequency to period, you will need to resample your data along the Y axis. LabVIEW includes a number of resampling algorithms, one of which should work for you. Process your data a vertical line at a time using one of them and you should be good to go. Given the fixed nature of the resampling, you should be able to make this quite efficient.
10-24-2011 02:22 PM
- Mark as New
- Bookmark
- Subscribe
- Mute
- Subscribe to RSS Feed
- Permalink
- Report to a Moderator
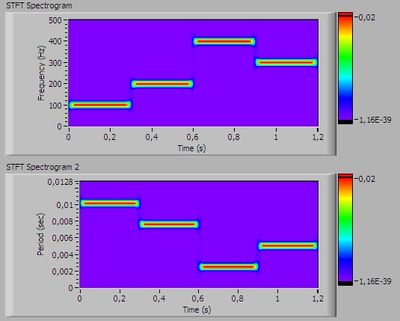
->this does not work... no ideas...
1. invers array,
2. setting Y scale.->
10-24-2011 05:54 PM
- Mark as New
- Bookmark
- Subscribe
- Mute
- Subscribe to RSS Feed
- Permalink
- Report to a Moderator
Hi borvsk,
How is the bottom graph not what you wanted? That looks like it is giving you the period of the frequency graph above. Please explain in more detail.
Jason L.
National Instruments
10-24-2011 10:11 PM
- Mark as New
- Bookmark
- Subscribe
- Mute
- Subscribe to RSS Feed
- Permalink
- Report to a Moderator
100Hz-0,01sec - good. 200Hz- 0,008sec -bad, 400Hz - 0,0025sec-good 300Hz-0,005sec- bad
100Hz=0,01sec, 200Hz=0,005sec, 400Hz=0,0025sec, 300Hz=0,00(3)sec.
10-25-2011 10:27 AM
- Mark as New
- Bookmark
- Subscribe
- Mute
- Subscribe to RSS Feed
- Permalink
- Report to a Moderator
Hi borovsk
I see what you mean in that it is incorrect. Do you mind posting a snippet of your block diagram? I think it would be beneficial for us if we can see that portion.
Jason L
National Instruments


