- Subscribe to RSS Feed
- Mark Topic as New
- Mark Topic as Read
- Float this Topic for Current User
- Bookmark
- Subscribe
- Mute
- Printer Friendly Page
Problem to plot the graph
04-30-2014 10:37 PM - edited 04-30-2014 10:39 PM
- Mark as New
- Bookmark
- Subscribe
- Mute
- Subscribe to RSS Feed
- Permalink
- Report to a Moderator
Regards
ade
04-30-2014 11:43 PM
- Mark as New
- Bookmark
- Subscribe
- Mute
- Subscribe to RSS Feed
- Permalink
- Report to a Moderator
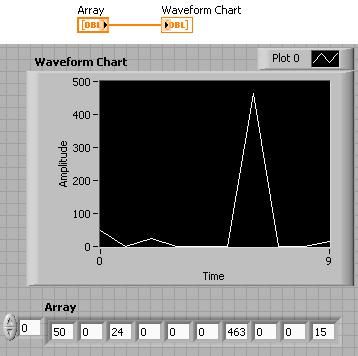
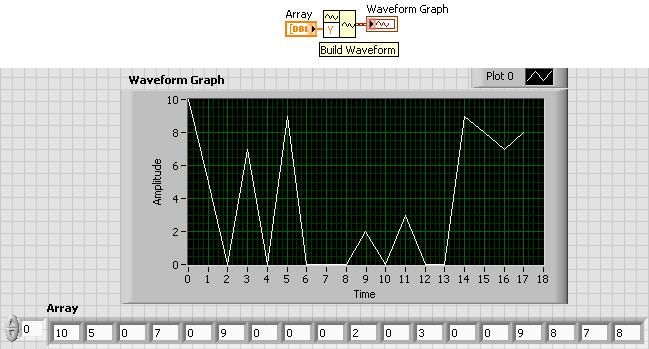
I don't know where you are encountering the problem with this so far? Would it be possible for you to post your code or an image of it so that we can get a better idea of what is going on. From what you have said so far there seems to be no reason that your graph would not be working. See image below for the simplest possible method of outputting to a graph.
05-01-2014 12:23 AM
- Mark as New
- Bookmark
- Subscribe
- Mute
- Subscribe to RSS Feed
- Permalink
- Report to a Moderator
how are you reading the excel file? Try using activex if u are not. You cannot use read spreadsheet.
05-01-2014
02:44 AM
- last edited on
06-09-2025
04:51 PM
by
![]() Content Cleaner
Content Cleaner
- Mark as New
- Bookmark
- Subscribe
- Mute
- Subscribe to RSS Feed
- Permalink
- Report to a Moderator
05-01-2014 04:12 AM
- Mark as New
- Bookmark
- Subscribe
- Mute
- Subscribe to RSS Feed
- Permalink
- Report to a Moderator
See if this is what u want
05-01-2014 10:21 AM
- Mark as New
- Bookmark
- Subscribe
- Mute
- Subscribe to RSS Feed
- Permalink
- Report to a Moderator
Thank you for your reply. I really appreciate it. In my previous diagram, instead of using the waveform chart (as shown in your figure), i use waveform graph. I tried to use the chart and it work but it keeps repeating the graph. How to stop it so i can only get 1 period of graph?. Because of the continuously repetition of the graph, i change my indicator back to waveform graph indicator but it doesnt show any plot. Here i attach my block diagram.
Again, thanks very much for your willing to help
Regards
Ade
and here is my fron nt panel
05-01-2014 03:58 PM
- Mark as New
- Bookmark
- Subscribe
- Mute
- Subscribe to RSS Feed
- Permalink
- Report to a Moderator
How are you running this program? From the look of it you should just be running the program once when you hit the run button as you do not have a while loop or anything surrounding the program This means that you should not get a repeating diagram from the waveform chart as it should only be updated once. If you are using the Run Continuosly Button (The looping arrows) to run your program, try running it simply from the single arrow. This should mean that the entire program will run through once generating only a single version of the points on the chart. If you have multiple waveforms that are being recorded in the file and only want to view a certain range of the chart, right-click on the chart and go X-Scale -> Properties and then adjust the X-Scale to fit your desired period. There are programmatic ways of doing this but for now we'll stick with this way.
From what you say about only wanting to see a single image of the information contained within the chart this seems like it should be exactly what you want. If you wish to persist in using the waveform graph then you will need to add in a time scale to the graph through using the generate waveform controller.
05-02-2014 10:57 AM
- Mark as New
- Bookmark
- Subscribe
- Mute
- Subscribe to RSS Feed
- Permalink
- Report to a Moderator
Hi,
thank you very much for your reply.
Previously, i change my excel data to CSV file before i applied it to the labview. Now, I am planning to change my simulation from using 'read from spreadsheet" to use the activex as shown in your VI . Im still in the very basic stage of understanding what is activex, how activex and labview works together, how to display the data in the labview table (previously in the array indicator), and also how to analyse/process the data so i will need more intensive time to learn. However, in your VI, i cannot run it because there is a mismatch particularly in Variant to data Function as shown in pict below
The thing that still make me curious until now is why i cannot plot my array of data in waveform graph. When i plot it in Chart, the plot is appear but in the graph, there is no plot. . i try to track by mark the point that might be plotted but it shows only in point 0,0. If you dont mind, can you look at my work in my attachment?. I will attach my VI, and also the data in csv format. Thanks before
Regards,
Ade
05-05-2014 11:12 AM
- Mark as New
- Bookmark
- Subscribe
- Mute
- Subscribe to RSS Feed
- Permalink
- Report to a Moderator
Hello Adepeter,
I am sending you an example that can help you write a table in Excel. You can also find more examples like this one regarding ActiveX in LabVIEW. Just go to help menu, then click find examples. Then in the browse tab, you open the "Communicating with External Applications" folder, then "ActiveX", then Excel.
Here you will find the example attached and many more.
Regards.
Ernesto
AE Engineer
National Instruments


