- Subscribe to RSS Feed
- Mark Topic as New
- Mark Topic as Read
- Float this Topic for Current User
- Bookmark
- Subscribe
- Mute
- Printer Friendly Page
Problem setting error bar size in multiple trace Error Bar Graph
Solved!02-22-2018 12:58 PM
- Mark as New
- Bookmark
- Subscribe
- Mute
- Subscribe to RSS Feed
- Permalink
- Report to a Moderator
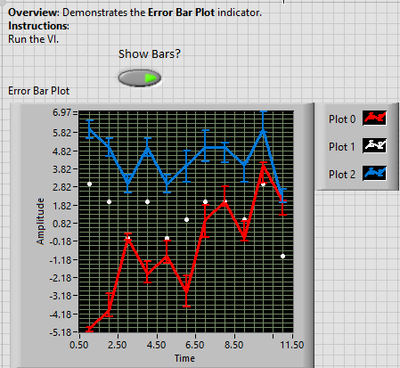
The users here want to optionally display error bars on graph traces. So I've been experimenting with making the error bars in the Error Bar Graph invisible. Demo vi attached.
I've been able to do this programmatically by feeding zero arrays to the error A an B vector inputs, and setting the Error Bar Size property to zero, but the size property setting only seems to work on the first, or Plot 0 trace. The horizontal error markers stay visible on Plot 3.
Anybody have an answer or know a better way to do this?
I've been able to control multiple cursors in XY graphs using the Cursor List array, but don't see anything of that sort here.
Thanks,
BG
Solved! Go to Solution.
02-22-2018 04:43 PM
- Mark as New
- Bookmark
- Subscribe
- Mute
- Subscribe to RSS Feed
- Permalink
- Report to a Moderator
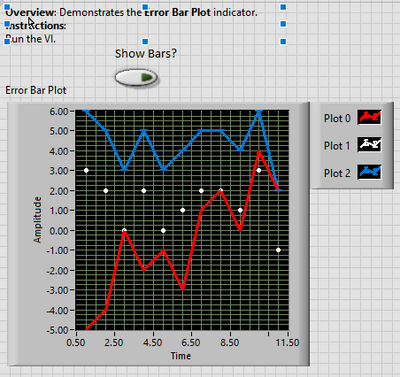
When I run your code using LabVIEW 2016, I think it works "just the way you want it to work". If Show Bars is off, I get three plots, with no error bars. If Show Bars is On, I get three plots with Error Bars on Plot 0 and Plot 2. That looks (to me) like what you asked the code to do, and it does it. So where's the problem?
Bob Schor
P.S. -- clever code!
02-22-2018 10:17 PM
- Mark as New
- Bookmark
- Subscribe
- Mute
- Subscribe to RSS Feed
- Permalink
- Report to a Moderator
Thanks Bob!
On my system (Lenovo R61, Win7, LV32), when the bars? switch is off, the horizontal tee bits of the error bars won't go away in the blue trace. I can manually shut them off in the graph legend, but the idea is to do it programmatically. Tomorrow I'll try this on a Win10 machine next door, maybe it's something systematic?
BG
02-23-2018 10:24 AM
- Mark as New
- Bookmark
- Subscribe
- Mute
- Subscribe to RSS Feed
- Permalink
- Report to a Moderator
Our systems seem to be the same (Win 7 x64, LV 32), but I have a Dell instead of a Lenovo. I don't think that matters. But I'm currently on a Win 10 machine -- let me give it a try here (also 32-bit LabVIEW 2016) ...
Bob Schor
02-23-2018 10:43 AM
- Mark as New
- Bookmark
- Subscribe
- Mute
- Subscribe to RSS Feed
- Permalink
- Report to a Moderator
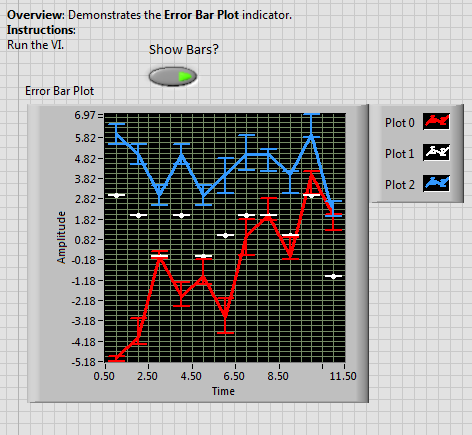
I can see that you are actually getting the same result. The horizontal dashes that would be at the ends of the error bars are still there in the blue Plot3 trace, and would be there in the white Plot2 trace if I hadn't turned them off manually by setting the the Size to zero in the Plots tab of the front panel legend. The reason for this format is that I'm trying to see if I can make it look just like the existing XY graphs in our MotionLab application where students analyze dropping balls, etc. in a video.
I suppose the question is, will anybody notice?
Maybe not, but it seems to me that NI is going to have to address this sooner or later, and either make the Size apply to all traces, or provide a Bars List property array similar to the Cursor List so they can be controlled individually and programmatically.
Or, maybe this already exists and I've overlooked it somehow? I ran into that a few weeks ago regarding the disabling of the runtime plot legends for these very graphs, where the selection was right there staring me in the face, but at a higher menu level than expected.
02-23-2018 12:41 PM
- Mark as New
- Bookmark
- Subscribe
- Mute
- Subscribe to RSS Feed
- Permalink
- Report to a Moderator
Sorry, I'm confused. When you say "Show Bars", I assume(d) you want to see the data + Error Bars, vertical lines going through the data points with little "hats" on their end to designate the interval corresponding to the chosen measure of variability. Did you want to plot only vertical lines, but no "hats"? You should be able to cook up a routine that simply plots a series of vertical lines that do this ...
Also, toggling the Boolean Control changes Plots 0 and 2 in identical fashion, and I thought your Original Post said only Plot 0 was affected -- more confusion on my part.
Bob Schor
02-23-2018 01:20 PM - edited 02-23-2018 01:35 PM
- Mark as New
- Bookmark
- Subscribe
- Mute
- Subscribe to RSS Feed
- Permalink
- Report to a Moderator
Hi Bob,
I've started a service request on this, we'll see where that goes.
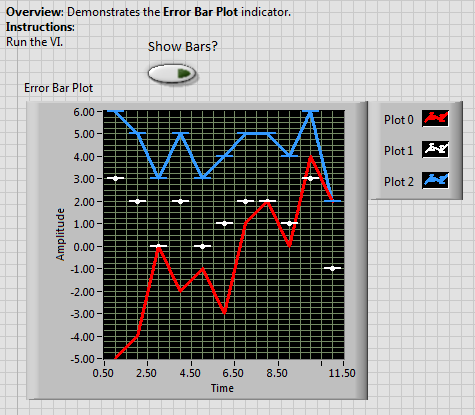
I'm trying to make the vertical bars AND hats disappear. You just are not looking close enough. When the Show Bars? boolean is false, the hats on the blue Plot2 collapse onto the data point, but remain visible, staying the same width.
I modified the demo vi, manually setting all the hats to size 4, so you can see clearly that they are still there on plots 1&2.
Also inserted screenshots, should have done that before:
02-23-2018 05:03 PM
- Mark as New
- Bookmark
- Subscribe
- Mute
- Subscribe to RSS Feed
- Permalink
- Report to a Moderator
Thank you for setting me straight! That really is weird, and almost certainly is a bug.
Bob Schor
02-28-2018 03:02 PM
- Mark as New
- Bookmark
- Subscribe
- Mute
- Subscribe to RSS Feed
- Permalink
- Report to a Moderator
Timothy at NI figured it out. We can use the Active Plot property, incrementing it in a loop to set the Error Bar Size for each plot/trace. It was just defaulting to 0. New demo vi attached. Another example of a property or feature hiding in plain sight, that I just stopped seeing.
02-28-2018 08:16 PM
- Mark as New
- Bookmark
- Subscribe
- Mute
- Subscribe to RSS Feed
- Permalink
- Report to a Moderator
Now that you mention it, I recall (several years ago) handling a multi-trace Chart and having to loop Active Plot through all the channels to "tweak" each plot ... Oh, the pain that we forget. Glad the Mystery has gone away (and hats off to the NI Applications Engineers!).
Bob Schor


