- Subscribe to RSS Feed
- Mark Topic as New
- Mark Topic as Read
- Float this Topic for Current User
- Bookmark
- Subscribe
- Mute
- Printer Friendly Page
Plotting
Solved!12-11-2019 04:08 AM
- Mark as New
- Bookmark
- Subscribe
- Mute
- Subscribe to RSS Feed
- Permalink
- Report to a Moderator
Hello everyone,
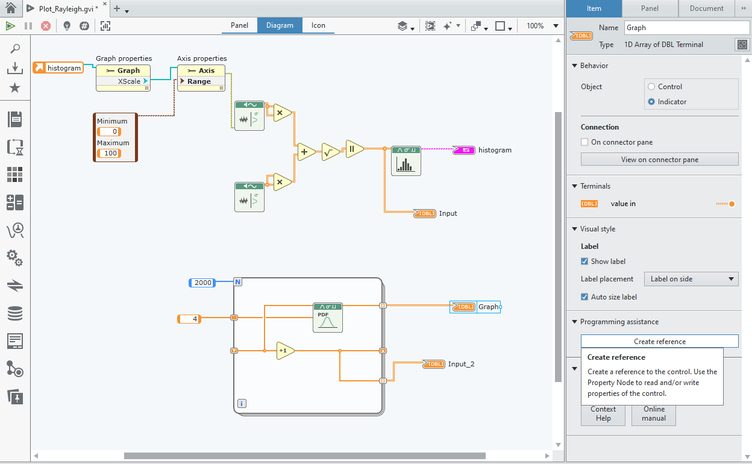
I want to plot a simulated Rayleigh distribution with the theoretical one, but I have two problems.
1. The y axis is different
2. The simulated is obtained using the histogram block which creates a cluster graph, and because the simulated is obtained using an array
I cannot use build array function to put them in one graph.
please see the attached pictures below
Solved! Go to Solution.
12-12-2019 01:01 PM
- Mark as New
- Bookmark
- Subscribe
- Mute
- Subscribe to RSS Feed
- Permalink
- Report to a Moderator
Hi Ali,
Would you attach your project please? That will make it easier to explore the issue.
This seems like scaling issue between your simulated and theoretical distributions. What are the X inputs that you are giving each one?
Thanks,
Fran
12-13-2019 03:51 AM
- Mark as New
- Bookmark
- Subscribe
- Mute
- Subscribe to RSS Feed
- Permalink
- Report to a Moderator
Thanks for replying,
here you go.
Best Regards,
Ali
12-13-2019 04:12 AM
- Mark as New
- Bookmark
- Subscribe
- Mute
- Subscribe to RSS Feed
- Permalink
- Report to a Moderator
I do not know how to give a specific X and Y axis, can you tell me how to do it ?
Many thanks,
Ali
12-16-2019
06:10 PM
- last edited on
11-05-2025
09:53 AM
by
![]() Content Cleaner
Content Cleaner
- Mark as New
- Bookmark
- Subscribe
- Mute
- Subscribe to RSS Feed
- Permalink
- Report to a Moderator
Hi Ali,
For plots, you can use Property Nodes to set X/Y ranges. To do that, you can create a reference to the Graph or Histograph and use Property Nodes to modify them. See below for more info:
https://knowledge.ni.com/KnowledgeArticleDetails?id=kA00Z0000019ZclSAE&l=en-US
For the actual difference in the two plots, I would point you toward the Help for each. The main difference stem from the fact the Histogram is computed numerical and the PDF is generated using an equation. I would also take a look at your X inputs as well:
Thanks,
Frank
12-17-2019 02:05 AM
- Mark as New
- Bookmark
- Subscribe
- Mute
- Subscribe to RSS Feed
- Permalink
- Report to a Moderator
Hello Frank,
Thanks for the information, it is really helpful.
Perhaps you can also help me to do maximum likelihood estimation so that I can estimate the distribution parameters ?
Best regards,
Ali
12-19-2019
09:34 AM
- last edited on
11-05-2025
09:54 AM
by
![]() Content Cleaner
Content Cleaner
- Mark as New
- Bookmark
- Subscribe
- Mute
- Subscribe to RSS Feed
- Permalink
- Report to a Moderator
Great, glad that helped, Ali!
There is not a built in toolkit for MLE for parameters. You could write a numerical method to do this in LabVIEW (or use C Node or Interface for MATLAB® if you prefer one of those). Here is a post with a simple version of the algorithm:
https://www.aminbros.com/maximum-likelihood-estimation/
Thanks,
Frank


