- Subscribe to RSS Feed
- Mark Topic as New
- Mark Topic as Read
- Float this Topic for Current User
- Bookmark
- Subscribe
- Mute
- Printer Friendly Page
Manually adjust absolute time on graph
05-21-2007 03:47 PM
- Mark as New
- Bookmark
- Subscribe
- Mute
- Subscribe to RSS Feed
- Permalink
- Report to a Moderator
05-21-2007 07:27 PM
- Mark as New
- Bookmark
- Subscribe
- Mute
- Subscribe to RSS Feed
- Permalink
- Report to a Moderator
Mike...
Certified Professional Instructor
Certified LabVIEW Architect
LabVIEW Champion
"... after all, He's not a tame lion..."
For help with grief and grieving.
05-22-2007 07:54 AM
- Mark as New
- Bookmark
- Subscribe
- Mute
- Subscribe to RSS Feed
- Permalink
- Report to a Moderator
I would like to vary the minimum and maximum time/date with scroll bars so I could look at large trends or zero in on shorter time frames.
Thank you
05-22-2007 06:37 PM
- Mark as New
- Bookmark
- Subscribe
- Mute
- Subscribe to RSS Feed
- Permalink
- Report to a Moderator
One possible solution would be to use a property node for your waveform graph, with the property: Xscale»Range»All Elements. Then, you could create a control and change your X minimum, maximum and increment with front panel controls.
I've attached a LabVIEW 8.2.1 example, let me know if this is what you were looking to accomplish!
Best regards,
05-22-2007 07:59 PM
- Mark as New
- Bookmark
- Subscribe
- Mute
- Subscribe to RSS Feed
- Permalink
- Report to a Moderator
OR
you could just plot all the data and let the zoom controls on the graph handle the selection...
Mike...
Certified Professional Instructor
Certified LabVIEW Architect
LabVIEW Champion
"... after all, He's not a tame lion..."
For help with grief and grieving.
05-23-2007 08:38 AM - edited 05-23-2007 08:38 AM
- Mark as New
- Bookmark
- Subscribe
- Mute
- Subscribe to RSS Feed
- Permalink
- Report to a Moderator
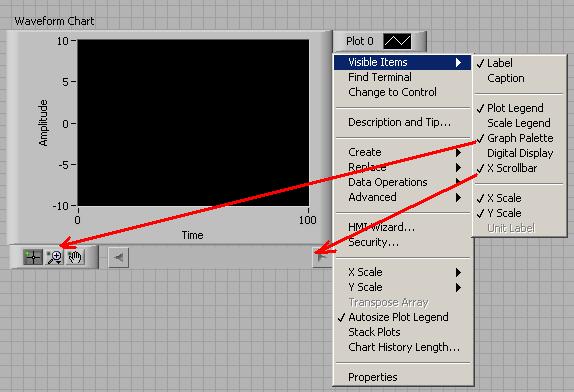
Zoom control or scroll bar.
Ben
Message Edited by Ben on 05-23-2007 08:38 AM
02-16-2010 08:50 PM
- Mark as New
- Bookmark
- Subscribe
- Mute
- Subscribe to RSS Feed
- Permalink
- Report to a Moderator
I'm liking Mike Porter's suggestion
mikeporter wrote:I was sort of thinking it might look nice to have a horizontal slide control with two sliders on it. The left end of the slider would be the minimum timestamp in the data, while the right end of the slider would be the maximum timestamp in the data. You could then create a value change event on the slide control that would use the position of the two sliders to segment out the data to display.
has anyone looked any further into this. I've tried this method, but my biggest concern is that the digital displays for the sliders can't be formatted to display time like the scale. Is there a way to change this, or am I going to have to go the XControl way.

02-19-2010 04:24 PM
- Mark as New
- Bookmark
- Subscribe
- Mute
- Subscribe to RSS Feed
- Permalink
- Report to a Moderator
Hi Settlesj,
I have been playing around with the slider control and I couldn't get the digital displays to show the timestamp, but I did come up with a workaround by using the To Timestamp Function. Please see the picture attached.
I will also file a product suggestion saying that the digital display should be able to show the timestamp.
Claire Reid
National Instruments
