- Subscribe to RSS Feed
- Mark Topic as New
- Mark Topic as Read
- Float this Topic for Current User
- Bookmark
- Subscribe
- Mute
- Printer Friendly Page
MS Office Report Toolkit Formatting Column Header data as a Row in Excel
Solved!08-03-2009 09:54 AM
- Mark as New
- Bookmark
- Subscribe
- Mute
- Subscribe to RSS Feed
- Permalink
- Report to a Moderator
....sorry for the duplicate post.....I'm having issues this morning.
I know I'm going to feel silly when I get the answer for this one. But I'm not getting anywhere on my own now.
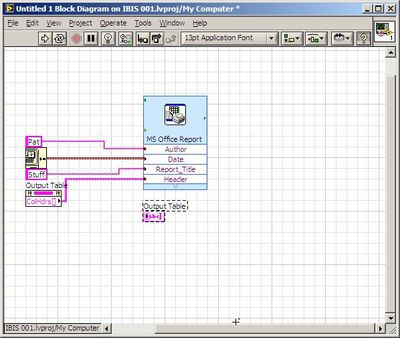
I'm using the MS Office Report Toolkit to create an Excel report from a table in a LabVIEW application.
I spent some time figuring out how to create Named Ranges in the Excel Template I created. That seems to be working, because I can see the inputs to the icon on the LabVIEW block diagram.
The problem I'm having is with the Table's Column Headers.
I created a Named Range that is an entire row of my Excel Template. When I use the property node to send the Column Header values to the template, the data appears as a column in the spreadsheet. So far, I haven't been able to figure out how to enter this data as a row instead of a column.
Is there a way?


Solved! Go to Solution.
08-03-2009 10:08 AM
- Mark as New
- Bookmark
- Subscribe
- Mute
- Subscribe to RSS Feed
- Permalink
- Report to a Moderator
Looks like I found my own answer.
Seems that all I need to do was convert my Header data into a 2D array.

Don't know why that one was so tricky to figure out. But it's working now.
04-27-2021 02:23 PM
- Mark as New
- Bookmark
- Subscribe
- Mute
- Subscribe to RSS Feed
- Permalink
- Report to a Moderator
Great!
Usually you create a Row input, it will get in Row.
You create as column input, it will fit in column.

