- Subscribe to RSS Feed
- Mark Topic as New
- Mark Topic as Read
- Float this Topic for Current User
- Bookmark
- Subscribe
- Mute
- Printer Friendly Page
- « Previous
-
- 1
- 2
- Next »
Is there any method to plot a Graph and its regression line together in a single graph or chart.
09-18-2017 09:45 PM
- Mark as New
- Bookmark
- Subscribe
- Mute
- Subscribe to RSS Feed
- Permalink
- Report to a Moderator
This plot is not getting formed in different colors... and am currently working on it!!
09-18-2017 10:41 PM
- Mark as New
- Bookmark
- Subscribe
- Mute
- Subscribe to RSS Feed
- Permalink
- Report to a Moderator
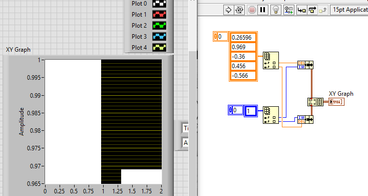
You are only plotting two points since you are taking individual elements out of your 1-D arrays. Then building those into a cluster and building them into an array, you now have a 1-D array of points which is a single plot.
I have not idea what the white parts of your graph are. Is that a bar graph?
Look at the example XY Graph Data Types in the example finder to learn how to create XY graphs.
09-18-2017 10:57 PM - edited 09-18-2017 11:18 PM
- Mark as New
- Bookmark
- Subscribe
- Mute
- Subscribe to RSS Feed
- Permalink
- Report to a Moderator
@RavensFan wrote:
You are only plotting two points since you are taking individual elements out of your 1-D arrays. Then building those into a cluster and building them into an array, you now have a 1-D array of points which is a single plot.
I have not idea what the white parts of your graph are. Is that a bar graph?
Look at the example XY Graph Data Types in the example finder to learn how to create XY graphs.
Yes Raven, that's bar plot.. sorry that my previous post is the method to plot a single plot. So, it doesn't make any difference.
Actually, I was looking for a bar graph which would differentiate each and every bar's in a single plot with different colors, as each data in the constant y-axis - row represents different (acquired) result values.
Then I switched over to different individual plots, as my idea of implementing the above graph is not possible within a single plot (thought some property node, could do).
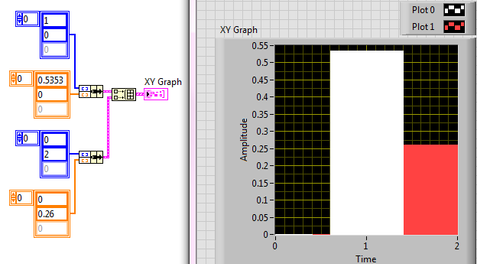
But, all data (in .png) in given array of DBL represents a single array of data that is acquired which will be as: 1 D array of {0.5353,0.26}
When implementing a diagonal method to do that, all 0's in the x & y axis have the plot's color which is because of the method I have tried to implement in the code.
But, my actual plot should look like I have mentioned in Message 5 of 13.
09-18-2017 11:37 PM
- Mark as New
- Bookmark
- Subscribe
- Mute
- Subscribe to RSS Feed
- Permalink
- Report to a Moderator
@crabman wrote:
@PriyadarsiniS wrote:
& similarly is this (above mentioned plot) possible in LabVIEW.. i.e.,I need to
put every plot with different color's in order to differentiate column corresponding
data.
Yes this is possible in LabVIEW. I would go for a saparate plot on an XY-graph for every column.
carbman, could you please elaborate your method...
I tried and its just overlapping with the subsequent plots.
09-19-2017 01:48 AM
- Mark as New
- Bookmark
- Subscribe
- Mute
- Subscribe to RSS Feed
- Permalink
- Report to a Moderator
See attached what I thought about. Note that it's likely that there are many other and more elegant ways to do this. But the result is pretty close to what you want:
- « Previous
-
- 1
- 2
- Next »


