- Subscribe to RSS Feed
- Mark Topic as New
- Mark Topic as Read
- Float this Topic for Current User
- Bookmark
- Subscribe
- Mute
- Printer Friendly Page
How to get a trendline plot in LabVIEW like Excel
07-29-2008 01:51 PM
- Mark as New
- Bookmark
- Subscribe
- Mute
- Subscribe to RSS Feed
- Permalink
- Report to a Moderator
07-29-2008 02:18 PM
- Mark as New
- Bookmark
- Subscribe
- Mute
- Subscribe to RSS Feed
- Permalink
- Report to a Moderator
07-29-2008 08:01 PM
- Mark as New
- Bookmark
- Subscribe
- Mute
- Subscribe to RSS Feed
- Permalink
- Report to a Moderator
Here is a sample Excel spreadsheet with the data and trendline plot.
Any help would be very much appreciated!
Thanks,
Todd
07-30-2008 05:46 AM
- Mark as New
- Bookmark
- Subscribe
- Mute
- Subscribe to RSS Feed
- Permalink
- Report to a Moderator
07-30-2008 09:21 AM - edited 07-30-2008 09:21 AM
- Mark as New
- Bookmark
- Subscribe
- Mute
- Subscribe to RSS Feed
- Permalink
- Report to a Moderator
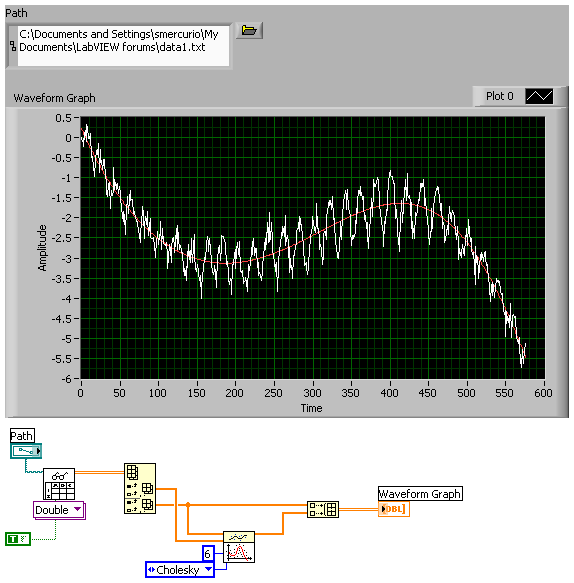
Seems like a pretty-good fit to me. I'm not sure what you're trying to do with the polynomial evaluation stuff, though.
Message Edited by smercurio_fc on 07-30-2008 09:21 AM
07-30-2008 09:31 AM
- Mark as New
- Bookmark
- Subscribe
- Mute
- Subscribe to RSS Feed
- Permalink
- Report to a Moderator
I was only looking at the polynomial coefficients...didn't even think of checking the other outputs of the the poly-fit vi. Thanks for pointing out the obvious to a 13 year LabVIEW veteran (mostly communications using RS232, TCP, ISO-9141, CAN, etc)!
Strange, why doesn't using the poly-coefficients (i.e. f(x)=a0+a1*x+a2*x^2+a3*x^3+a4*x^4+a5*x^5) create the same result?
07-30-2008 09:58 AM
- Mark as New
- Bookmark
- Subscribe
- Mute
- Subscribe to RSS Feed
- Permalink
- Report to a Moderator
07-30-2008 10:24 AM
- Mark as New
- Bookmark
- Subscribe
- Mute
- Subscribe to RSS Feed
- Permalink
- Report to a Moderator
05-19-2022 08:58 AM
- Mark as New
- Bookmark
- Subscribe
- Mute
- Subscribe to RSS Feed
- Permalink
- Report to a Moderator
This is an old thread but today I was struggling in plotting the next periods of a trendline like in Excel. So here is an example I did that could help someone else in the future.
