ni.com is currently experiencing slowness/issues due to ongoing maintenance.
Support teams are actively working on the soonest resolution.
ni.com is currently experiencing slowness/issues due to ongoing maintenance.
Support teams are actively working on the soonest resolution.
10-21-2015 01:14 AM
Based on the first post in this thread I suppose HanKiat is trying to add an upper/lower limit to his data after the acquisition process, not during.
I do agree with Dennis_Knutson that it will be easier for others to help if HanKiat can give more details on what he is trying to do.
10-21-2015 04:28 AM
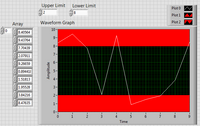
Sorry for the confusion, I actually wanna make the graph line change colour when it exceed a certain limit, but I did some research and it seems impossible. So I decided to just add in an upper limit and lower limit to the graph, maybe after that, I might wanna add in a function that sends an email to the owner when the thing goes over the upper limit or below the lower limit. But that can wait since I can't get the upper limit and lower limit to appear on my waveform graph...here a picture, the center bottom one is the thing i wanna achieve. Any suggestions? Thanks all for replying.
10-21-2015 06:30 AM
10-21-2015 08:01 AM
@HanKiat wrote:
Sorry for the confusion, I actually wanna make the graph line change colour when it exceed a certain limit, but I did some research and it seems impossible.
This is why it is important to state clearly what it is you are trying to do. Here are 100 points chosen using the LabVIEW Random Number generator (so they all are between 0 and 1). As you can see, I've plotted them on two Waveform Graphs. In the first, all of the points >= 0.8 are White, between 0.2 and 0.8 are Red, and below 0.2 are Green. To do this "quickly", I only plotting lines between successive points of the same color (it's a bit more work to make lines, and what color?, that cross the boundaries). In the second plot, I'm not plotting points, only the line (in red), with the upper and lower limits in white and green.
Are these anything like what you are trying to do (but "seems impossible")?
Bob Schor
10-21-2015 08:25 AM
I'm attaching a sub-VI (and Snippet) I just made to create the "Triple-Plot" shown on my previous post. It takes an Array of points in, along with upper and lower limits, and returns an array of 3 arrays, "Too Big", "Just Right", and "Too Small", that can be wired to a Waveform Graph for plotting (as shown in the first of the previous graphs).
Bob Schor
10-21-2015 08:30 AM
Hmm. There are some wires "hidden" when I resized my VI to make it "look pretty". Note that in the Case shown on the Snippet, the middle Output Tunnel on the inner Case appears to be unwired -- it is actually connected to NaN, but as I moved the right-hand edge of the Case to the left, it covered up this wire ... There may be one or two other such "oops!" appearances, but the code does work, and did make the first Graph I posted earlier ...
BS
10-21-2015 08:04 PM - edited 10-21-2015 08:09 PM
I've made a simple VI to achieve what you want in your Untitled2.png (Naming the file nicely might help others to refer next time). Basically it is also creating a triple array, but instead of plotting 2 lines for the upper and lower limits, you can actually fill to -infinity and +infinity. Follow the instructions below in order to fill to +/- infinity:
1. Right click on the waveform graph.
2. Select Properties.
3. Select Plots tab.
4. Choose the plot you want to be filled to infinity.
5. Choose your desired options in the Fill to menu ring (In red rectangle).
However, if you want the upper and lower limit plots to appear only when your data exceeds the limits, you may consider using some case structures and properties node.
Cheers,
DS Yiauw


10-21-2015 08:41 PM
Thanks all for trying to help out. I wanna make something like bob's one, but bob, the file you placed I can''t seem to open it on my labview...it said something about different version.. But I will try and follow that diagram and build it. Hope it works.
10-21-2015 09:09 PM
Bob, mind explaining in detail on how you make that circuit? since i cant open the file you attached. I did something like that diagram already
10-21-2015 09:19 PM
Hey DS Yiauw, I kind of did what you said, but for some reason, I think its because I am getting data out from NI myDAQ device, so there is nothing plotted on the graph...heres a picture of it.