- Subscribe to RSS Feed
- Mark Topic as New
- Mark Topic as Read
- Float this Topic for Current User
- Bookmark
- Subscribe
- Mute
- Printer Friendly Page
Having trouble creating bar graph
01-11-2008 10:39 AM
- Mark as New
- Bookmark
- Subscribe
- Mute
- Subscribe to RSS Feed
- Permalink
- Report to a Moderator
Thought this would be simple, but basically I am trying to do a visual representation of text with quantites in a bar graph.
Basically something like this:
6 ||
5 ||
4 || ||
3 || || ||
2 || || || ||
1 || || || || ||
NAME 1 NAME 2 NAME 3 NAME 4 NAME 5
Cannot figure this out. Any help would be appreciated. Thanks.
01-11-2008 10:54 AM - edited 01-11-2008 10:55 AM
- Mark as New
- Bookmark
- Subscribe
- Mute
- Subscribe to RSS Feed
- Permalink
- Report to a Moderator
Unlike the scales of numeric controls, graph scales don't support text labels (wouldn't that be cool! ;))
You have several possibilities:
- Use a picture indicator and explicitly draw your boxes and labels. Shouldn't be too hard.
- Use a graph, hide the x-axis and substitute something else for the text (annotations, "text label" scale of a hidden control, etc.)
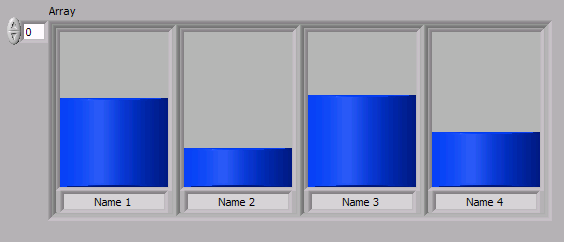
- Use an array where each element is a cluster of a tank and a string, for example (see image).
- ....
Message Edited by altenbach on 01-11-2008 08:55 AM
01-11-2008 11:17 AM
- Mark as New
- Bookmark
- Subscribe
- Mute
- Subscribe to RSS Feed
- Permalink
- Report to a Moderator
LV 2020
01-11-2008 11:33 AM
- Mark as New
- Bookmark
- Subscribe
- Mute
- Subscribe to RSS Feed
- Permalink
- Report to a Moderator
01-11-2008 11:49 AM
- Mark as New
- Bookmark
- Subscribe
- Mute
- Subscribe to RSS Feed
- Permalink
- Report to a Moderator
01-11-2008 11:50 AM
- Mark as New
- Bookmark
- Subscribe
- Mute
- Subscribe to RSS Feed
- Permalink
- Report to a Moderator
A demo of Christian's option #2 can be found here.

Ben
01-11-2008 12:12 PM - edited 01-11-2008 12:13 PM
- Mark as New
- Bookmark
- Subscribe
- Mute
- Subscribe to RSS Feed
- Permalink
- Report to a Moderator
I just created an empty constant by right clicking on the cursor list property to initialize a cursor for me to place on the graph. The text (Joe) is the cursor label, but the cursor itself is not set to be visible.
Ben,
Thanks for the lesson on picture controls. I don't understand the whole thing yet, but I will soon!
Message Edited by lmtis on 01-11-2008 12:13 PM
LV 2020
01-11-2008 12:17 PM
- Mark as New
- Bookmark
- Subscribe
- Mute
- Subscribe to RSS Feed
- Permalink
- Report to a Moderator
Roons1159 wrote:
Not the most experienced user, how would you do that tank idea. I like the look of that a lot.
- Place an empty cluster container on the front panel.
- Drop a tank indicator in it
- Drop a string indicator in it
- Arrange and resize as desired.
- Place an empty array container on the front panel.
- Place the cluster in it.
- Resize for the desired number of bars (=array elements).
01-11-2008 01:08 PM
- Mark as New
- Bookmark
- Subscribe
- Mute
- Subscribe to RSS Feed
- Permalink
- Report to a Moderator
01-11-2008 01:15 PM
- Mark as New
- Bookmark
- Subscribe
- Mute
- Subscribe to RSS Feed
- Permalink
- Report to a Moderator
I, too, am in the same boat as Roons1159. It seems like a simple bar graph function would have been easy enough for National Instruments to include with LabView, but I digress.
The solution posted by Ben looks promising, but unfortunately I don't have LabView 8.0, which his example is in (I'm using LabView 6.1). Would someone be able to open his example in 8.0 and try to save it for 6.1? I would be very grateful. I tried implementing it myself based on the pictures, but it seems like there are a few differences. For instance, I can't find a "Plot Bounds" property for the XY Graph, and the "Draw Text at Point" vi doesn't seem to have a place for the text orientation to be configured.
Thanks,
Ian
