- Subscribe to RSS Feed
- Mark Topic as New
- Mark Topic as Read
- Float this Topic for Current User
- Bookmark
- Subscribe
- Mute
- Printer Friendly Page
Error reading xls file
04-25-2008 12:12 PM
- Mark as New
- Bookmark
- Subscribe
- Mute
- Subscribe to RSS Feed
- Permalink
- Report to a Moderator
Why Does the "Read Waveform From File.vi" Behave Differently in the Run-time Engine?
what is the solution for this.Can you explain please.Iam also adding the vi file and the excel file I'm using.
Regards
Bharath
04-25-2008 12:44 PM - edited 04-25-2008 12:45 PM
- Mark as New
- Bookmark
- Subscribe
- Mute
- Subscribe to RSS Feed
- Permalink
- Report to a Moderator
Where did your data come from?
Message Edited by smercurio_fc on 04-25-2008 12:45 PM
04-25-2008 12:59 PM
- Mark as New
- Bookmark
- Subscribe
- Mute
- Subscribe to RSS Feed
- Permalink
- Report to a Moderator
My data is external.It is taken from one simualtion in matlab.
How do i read that data that is in text or Excel format.
Can you please tell me a way?
Bharath
04-25-2008 01:09 PM - edited 04-25-2008 01:09 PM
- Mark as New
- Bookmark
- Subscribe
- Mute
- Subscribe to RSS Feed
- Permalink
- Report to a Moderator
Check the LabVIEW Help for more information on Read From Spreadsheet File.
Message Edited by smercurio_fc on 04-25-2008 01:09 PM
04-25-2008 01:14 PM - edited 04-25-2008 01:15 PM
- Mark as New
- Bookmark
- Subscribe
- Mute
- Subscribe to RSS Feed
- Permalink
- Report to a Moderator
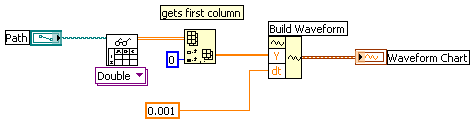
If you save the file as tab separated text, then the code below will read the file and display the waveform.

Message Edited by Dennis Knutson on 04-25-2008 12:15 PM
04-25-2008 01:21 PM
- Mark as New
- Bookmark
- Subscribe
- Mute
- Subscribe to RSS Feed
- Permalink
- Report to a Moderator
Note that Dennis is showing you a waveform graph, while the example I provided used a waveform chart, which is what you initially were using. Both are valid - you will need to decide which method is more appropriate for you.
04-25-2008 01:39 PM
- Mark as New
- Bookmark
- Subscribe
- Mute
- Subscribe to RSS Feed
- Permalink
- Report to a Moderator
Dennis,where do i get the last block (you've written 'DBL' in it.).
I've been searching but i am missing it.
04-25-2008 01:42 PM - edited 04-25-2008 01:44 PM
- Mark as New
- Bookmark
- Subscribe
- Mute
- Subscribe to RSS Feed
- Permalink
- Report to a Moderator
You don't know where to find a waveform graph?

Please spend some time at http://www.ni.com/academic/lv_training/how_learn_lv.htm
Message Edited by Dennis Knutson on 04-25-2008 12:42 PM
Message Edited by Dennis Knutson on 04-25-2008 12:44 PM
04-26-2008 11:06 AM
- Mark as New
- Bookmark
- Subscribe
- Mute
- Subscribe to RSS Feed
- Permalink
- Report to a Moderator
I tried the simualtion you are given.It is giving the waveform but a portion of it only showing. Any time only 1023 samples of data is coming. That too it is coming from 17111 to 18134.I tried to change all the axis and scaling even then it is not changing. I am attaching the text files with tabs inside the elements. Can you please explain me the reason or can you send me the spread sheet file you've given for the simulation.
Thanks
Bharath.


04-26-2008 11:15 AM - edited 04-26-2008 11:16 AM
- Mark as New
- Bookmark
- Subscribe
- Mute
- Subscribe to RSS Feed
- Permalink
- Report to a Moderator
We cannot see any of your images, because they point to your hard drive which is not public. Please attach images first.

Please attach your data file, so we can see why it reads only 1k points.
Message Edited by altenbach on 04-26-2008 09:16 AM
