- Subscribe to RSS Feed
- Mark Topic as New
- Mark Topic as Read
- Float this Topic for Current User
- Bookmark
- Subscribe
- Mute
- Printer Friendly Page
Delay between tabs with large dataset
Solved!05-01-2020 01:38 PM
- Mark as New
- Bookmark
- Subscribe
- Mute
- Subscribe to RSS Feed
- Permalink
- Report to a Moderator
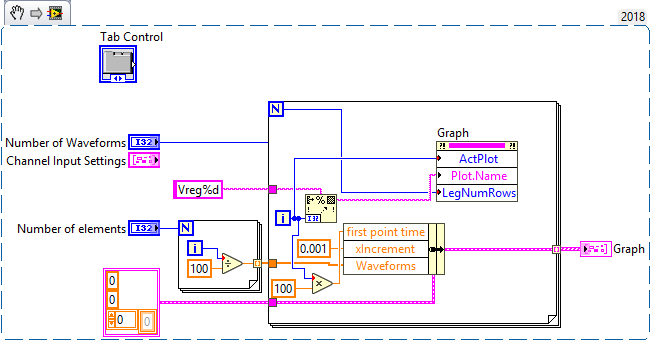
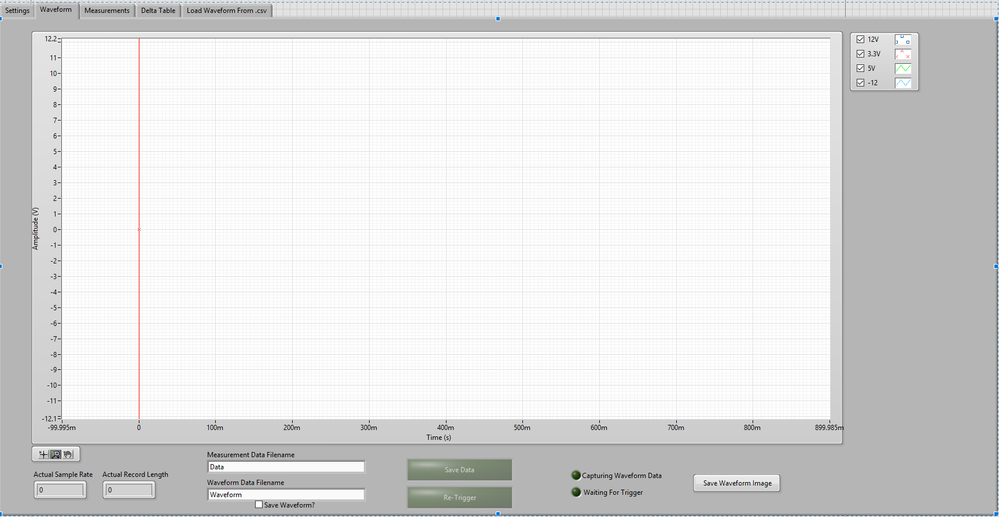
This is a small snippet I created from a much larger program. The problem I'm having is when I switch between tabs and the tab I'm switching to has a large dataset, there is a few second delay before the tab switches. I didn't find much info from my searches, so I was hoping somebody that knows what's going on can provide more information. If that's just the nature of LabView, then that's fine, but if there's an optimization, I'd like to be able to implement it.
Solved! Go to Solution.
05-01-2020 02:48 PM - edited 05-01-2020 02:56 PM
- Mark as New
- Bookmark
- Subscribe
- Mute
- Subscribe to RSS Feed
- Permalink
- Report to a Moderator
05-01-2020 02:53 PM
- Mark as New
- Bookmark
- Subscribe
- Mute
- Subscribe to RSS Feed
- Permalink
- Report to a Moderator
You graph is severly taxing the UI thread. There is a nonzero cost graphing so much data:
3M x 24 x 8bytes/point is almost 600MB!!
It is not reasonable to graph that much data! Given that your graph only has about 400k pixels, it seem silly to graph 72M points on 0.4M pixels, right. Can't you decimate your data somehow?
05-01-2020 03:15 PM
- Mark as New
- Bookmark
- Subscribe
- Mute
- Subscribe to RSS Feed
- Permalink
- Report to a Moderator
Six or seven years ago, I heard a seasoned LabVIEW Developer talking about "What to do" and "What Not to Do". Among the latter advice was "Do Not Use Tab Controls", particularly if the reason for the Tab was to "cheat" and create a HUGE Front Panel, showing one Screen's worth at a time.
The advice (which can achieve the same basic result, still "cheating") was to use a sub-Panel. The code that you formerly executed in, say, Tab 1, you now execute in sub-VI "Tab 1.vi". The Front Panel of the Tab 1 VI has all of the Controls and Indicators that you had on the former Tab Control's Tab 1, and the sub-VI executes all of the code that you formerly had in the Case Statement corresponding to Tab 1 being selected. The difference is that in place of the (large) Tab Control, you have an equally-large sub-Panel, and when you want to execute the Tab 1 code, you load the Tab 1 sub-VI into the sub-Panel Control and it runs, allowing you to interact with the sub-VI's Front Panel just as you used to interact with the same Controls that were part of your Main VI.
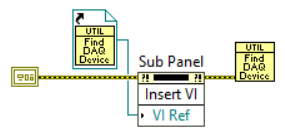
This is a much more flexible technique than using Tab Controls. To get yourself started, create a blank VI, and on its Front Panel, go to the Layouts Palette and drop a sub-Panel. Size it as big as you need (like the size you formerly used for the Tab Control). Now look at the Block Diagram -- you'll see a method for your sub-Panel waiting for you to insert a reference to the VI you want to run in it. Write a little VI, with some Controls and Indicators you want to use. Be sure this VI uses Error In and Error Out. Now place this VI right after the "Insert VI" node, connecting the VI's Error In to the sub-Panel Method's Error Out. Finally, drop a Static VI Reference (Application Control Palette), right-click it and choose "Browse for Path" to find the path to the VI you just wired to be run after you stick its Front Panel in the Window, and wire this reference to the "VI Ref" input. Here's a picture (the above is < 1000 words, but getting uncomfortably close ...).
When your Main program gets here (here = the place in your code where you want to execute whatever was dealing with the Controls and Indicators on Tab Control 1), this little Snippet will run the Tab 1 VI (here I used a VI of my own called Find DAQ References -- I was too lazy to build a dummy Tab 1 VI), processing its Controls and Indicators in the VI you specify. When it is done, it just exits and whatever is next on the Error Wire runs and can use any of the data that Tab 1 VI puts on its Output Indicators. To switch Tabs, you simply put the VI representing, say, Tab 3 (or whatever Tab you want) there.
But how do you specify the Tab (or sub-Panel) you want? Any way you want! You can have a set of Boolean Buttons called Tab 1, Tab 2, etc, a Rotary Switch with these indicators, or something more inventive.
Bob Schor
05-01-2020 03:47 PM
- Mark as New
- Bookmark
- Subscribe
- Mute
- Subscribe to RSS Feed
- Permalink
- Report to a Moderator
@altenbach wrote:
You graph is severly taxing the UI thread. There is a nonzero cost graphing so much data:
3M x 24 x 8bytes/point is almost 600MB!!
It is not reasonable to graph that much data! Given that your graph only has about 400k pixels, it seem silly to graph 72M points on 0.4M pixels, right. Can't you decimate your data somehow?
I want the user to be able to zoom into the waveform (like you would on a scope), so eliminating too much of the data (or any at all) might mean that they can't see a spike or dropout on a waveform. I realize the amount of data is significant, but LabView seems to be able to handle it just fine in most situations. The speed in which LabView generates and graphs that amount of data is incredible... I'm just looking to see if there was a setting or something that I missed that could optimize what I'm trying to do.
05-01-2020 03:57 PM
- Mark as New
- Bookmark
- Subscribe
- Mute
- Subscribe to RSS Feed
- Permalink
- Report to a Moderator
@nickb34 wrote:I want the user to be able to zoom into the waveform (like you would on a scope), so eliminating too much of the data (or any at all) might mean that they can't see a spike or dropout on a waveform. I realize the amount of data is significant, but LabView seems to be able to handle it just fine in most situations. The speed in which LabView generates and graphs that amount of data is incredible... I'm just looking to see if there was a setting or something that I missed that could optimize what I'm trying to do
I do this all the time. Decimate your data, when the user zooms in or out, take a different part of your data and re-decimate if necessary.
mcduff
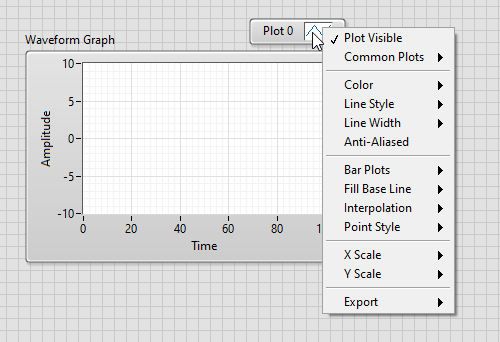
PS Turn Anti-aliasing and smooth updates off, should increase speed somewhat, but that is not your rate limiting step.
05-01-2020 04:15 PM
- Mark as New
- Bookmark
- Subscribe
- Mute
- Subscribe to RSS Feed
- Permalink
- Report to a Moderator
@nickb34 wrote:
@altenbach wrote:
You graph is severly taxing the UI thread. There is a nonzero cost graphing so much data:
3M x 24 x 8bytes/point is almost 600MB!!
It is not reasonable to graph that much data! Given that your graph only has about 400k pixels, it seem silly to graph 72M points on 0.4M pixels, right. Can't you decimate your data somehow?
I want the user to be able to zoom into the waveform (like you would on a scope), so eliminating t...
The speed in which LabView generates and graphs that amount of data is incredible... I'm just looking to see if there was a setting or something that I missed that could optimize what I'm trying to do.
If you switch to using a Waveform Data Type (see this nugget about sporatic waveform charts ) you can skip all of the mucking about with the property nodes ( that require switching to the UI thread to execute) and use the Waveform attributes to accomplish what you are doing with the property nodes.
Note: there is a right click option that will automatically resize the plot legend based on the number of channels of data you present to the chart.
The other thing that MAY work (sometimes it makes things worse so experiment) is to use a combination of "DeferFPUpdat" (set it true to defer updating the UI when you post up new data then false to turn the updates back on) AND possibly "set the chart to hidden" prior to applying an update.
Those last two suggestion may help or may hurt. It depends on what version of LV you are using, how powerful your hardware is, how much data is being plotted, how often...
Final thought.
Updating the GUI less often with more data can also help.
Have fun an let us know if any of that helps.
Ben
05-04-2020 11:35 AM
- Mark as New
- Bookmark
- Subscribe
- Mute
- Subscribe to RSS Feed
- Permalink
- Report to a Moderator
I had first taken the idea of decimation to mean to modify the original set of data, but now this makes a lot more sense when thinking about creating a whole new set of data based on the original. I'm imagining something like an event based on clicking on the plot, checking to see if the dimensions have changed, and then performing the decimation based on some ratio of the waveform interval and the time axis.
05-04-2020 11:46 AM
- Mark as New
- Bookmark
- Subscribe
- Mute
- Subscribe to RSS Feed
- Permalink
- Report to a Moderator
@nickb34 wrote:
I had first taken the idea of decimation to mean to modify the original set of data, but now this makes a lot more sense when thinking about creating a whole new set of data based on the original. I'm imagining something like an event based on clicking on the plot, checking to see if the dimensions have changed, and then performing the decimation based on some ratio of the waveform interval and the time axis.
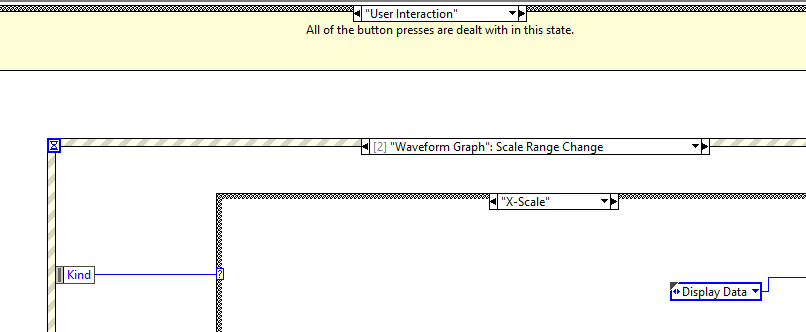
Good thought. That is exactly what I do. Note that you only need to change the decimation and display when the "x-axis" changes, no need to re-decimate if ONLY the y-axis changes.There is a "Scale Range" Change event for plots that you can use. The event will give the min and max of the range. You can use that to find the indices of the data array that you need to decimate.
mcduff
05-11-2020 02:43 PM
- Mark as New
- Bookmark
- Subscribe
- Mute
- Subscribe to RSS Feed
- Permalink
- Report to a Moderator
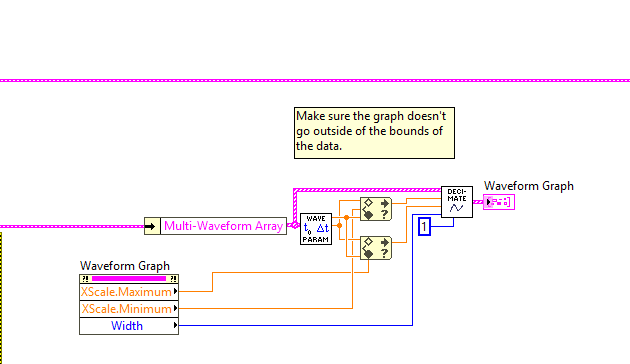
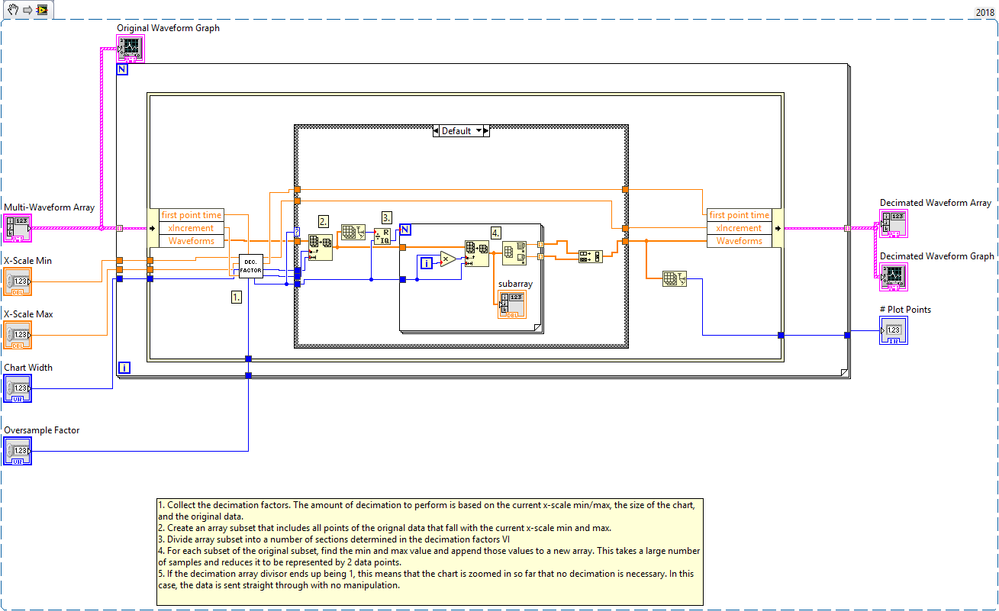
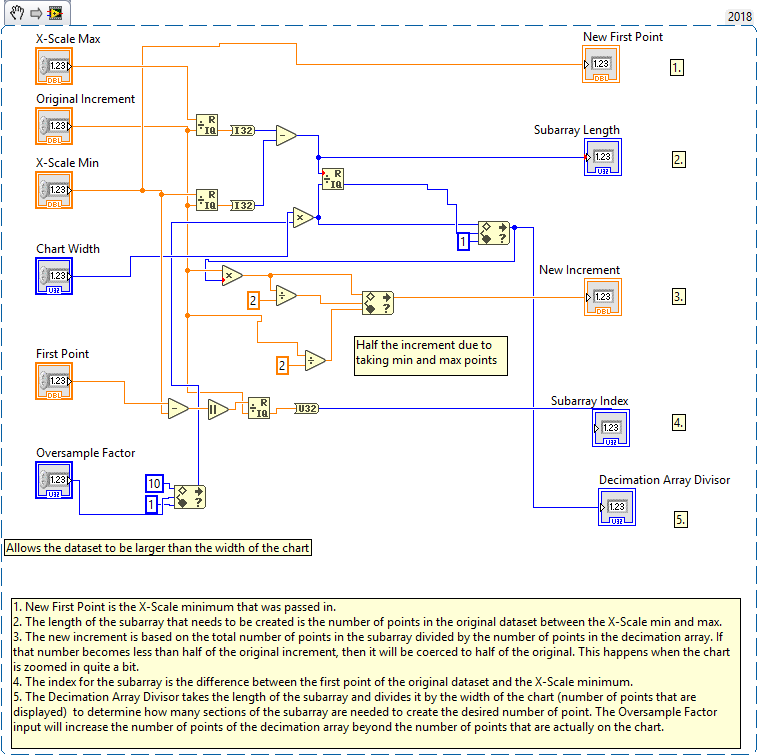
I wanted to share my solution, hoping that it may help somebody down the road. Decimation is a simple concept, but implemenation is a whole other story.
